Background
In this Unit, students will build an understanding of what data is, and how sensors produce data that can be used to solve real world problems. They will act as bridge inspectors, and use the Eye Sensor on the GO Code Base to scan "bridges" to detect cracks using the data from the Eye Sensor. They will learn to analyze data to make conclusions about bridge safety, and how to use data along with the scientific method to make and test a hypothesis about which bridges in particular are in need of repair. They will report their data based results in a Bridge Inspection Report.
What is Data?

Data is information that is collected and used for reference or analysis. There are many different types of data that students interact with daily. From checking the weather forecast to decide what to wear, to using GPS for travel, data is a constant presence. In professional settings, data informs everything from business strategies to medical diagnoses. In this Unit, students will be focusing on data related to VEX GO.
A sensor reports data about the world around it. Sensor data can be used for a robot to make decisions, or can be collected and presented as evidence in order to support or refute a claim. In this Unit, students learn to collect Eye Sensor data, and then to use data to test a claim that is given to them. Throughout the Unit, they record and present data using Data Collection Sheets and display their data in Bridge Inspection Reports. By the end of the Unit, they will make their own claims, collect sensor data to test the claim, and use the collected data as evidence to determine if their claim is true. Although this Unit focuses on sensor data, collecting, organizing and interpreting data then using it to support a claim is a valuable skill that students will use across academic disciplines.
What is a Sensor?
A sensor is a device that helps a robot or device to understand the world around it. It does this by collecting input from its environment, and converting it into a form that can be read and understood. We interact with sensors every day. One common example is an automatic door at a supermarket. A motion sensor mounted above the door emits microwave signals or ultrasonic waves, which bounce back to the sensor. When a person approaches the door, the waves are interrupted, changing the pattern of the signals that bounce back. The sensor detects this change and sends an electrical signal to the door's control mechanism, prompting it to open.
In order for students to successfully learn how to code a robot, they must understand how the sensors they are using function, because a sensor's data is only as good as the input it receives. In our automatic door example, if the sensor on the door detects a change in the ultrasonic waves bouncing back to it because of a heavy rain, the door will open even though there is nobody there to let into the store.
An understanding of how the door's sensor works allows for troubleshooting to fix the issue. Perhaps adding a larger awning over the store's doors will prevent the sensor from being affected by the rain. The same is true for students learning to code a robot. When coding, unexpected sensor data can cause the robot to behave in ways students don't anticipate, sometimes leading them to think the robot or sensor is broken. Students must understand how sensors obtain and report information in order to avoid this and to have a foundation on which to base troubleshooting a coding project.
In this unit, students will be using the Eye Sensor to collect data. Students will need to know how the Eye Sensor collects data in order to use the data successfully to answer questions. This understanding will also allow students to build and debug more complex projects using the Eye Sensor in the future.
The VEX GO Eye Sensor
How the VEX GO Eye Sensor Works
The VEX GO Eye Sensor does not detect colors. Rather, it detects if an object is near, and if so, displays the digital hue value of that object. The sensor works by emitting a white light. The light is then reflected back by the object, and the Eye Sensor measures the intensity of the colors in the reflected light. The sensor performs a calculation based on those levels of intensity to determine a hue value, which is reported in the VEXcode GO Monitor. The hue value can be interpreted by using a hue chart to determine a color.
You may have used the Eye Sensor in a project that had the robot perform a behavior based on the color detected (like turning right if blue was detected). In order to do this, the hue value that is determined by the sensor is compared to the predetermined ranges for red, blue, and green. If the value is within that range, it will report as 'True'; if it is not, it will report as 'False'. The sensor is still not detecting the color red, blue, or green – it is comparing the numerical data to known ranges of values and essentially 'converting' the data to colors for us.
Viewing Sensor Data
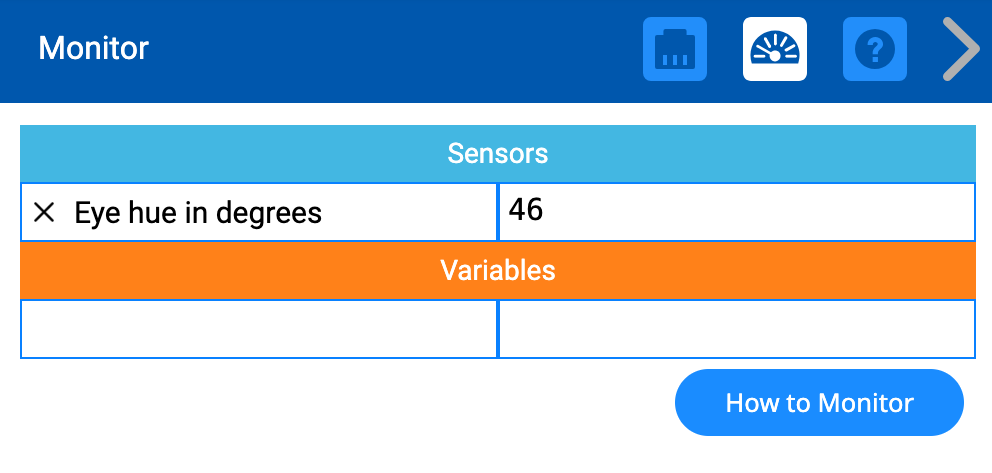
The data reported by the Eye Sensor can be seen in the Monitor Console as a project is running. To view sensor data in the Monitor, drag a sensing block from the Toolbox to the Monitor Icon. The Eye hue in degrees will be shown as a hue value, which can be compared by students to the Hue Chart in order to determine the color the Eye Sensor thinks it detects.

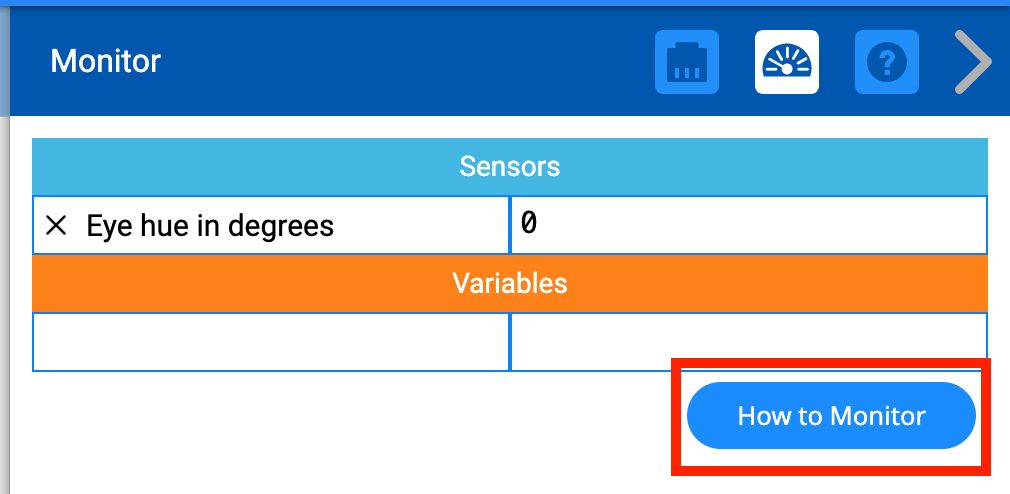
For a reminder on how to Monitor sensor values, select the How to Monitor button at any time.
The Hue Chart
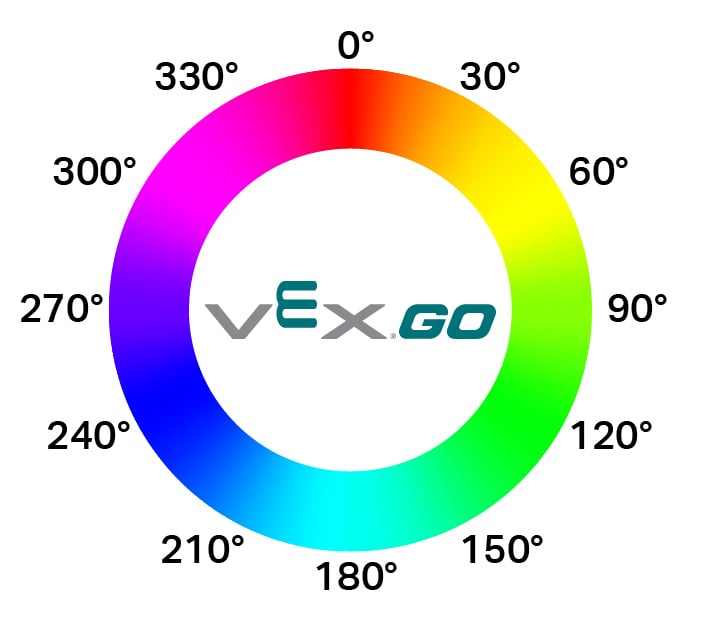
The Hue Chart depicts the numerical values for each color as reported by the Eye Sensor. The hue value ranges from 0 to 360 degrees, beginning with red and moving in rainbow order around the circular chart. At times, the hue value detected may not match the color that you see present in the environment. This can be due to the quality of the ambient light present around the sensor, and does not mean the sensor is malfunctioning.

Ambient Light and the Eye Sensor
Because color is reflected light, the ambient light (light present in the area where the sensor is used) will affect the hue value reported by the sensor. For example, a green VEX GO Beam may report the number '57', which falls into the 'yellow' area on the Hue Chart. This is not due to a sensor malfunction, but instead due to the ambient light present around the sensor. The hue values may read differently for different students in the same classroom, even if they are scanning the same object with the Eye Sensor. This is all dependent on the amount of light in the area where students are located. Being seated near a window, for example, or on a particularly cloudy day, may change the way the sensor reports hue value data.
In Lab 1, students will view the numerical Eye Sensor data in the VEXcode GO Monitor. They will record the data from the different bridge sections they are scanning using the Eye Sensor and match the numerical data to the Hue Chart. They will then compare the values reported by the sensor with and without using the Eye Light. These values will be different because when more light is illuminating the object detected by the sensor, the intensity of the reflected light will change, thus changing the reported hue value. This will help to build the students' understanding of how the Eye Sensor is detecting information.
Black, White, and Gray
Students may notice that the reported hue values for black, white, or gray (like the colors on the Tile) are unreliable. This is because black is essentially the absence of color and white is essentially the combination of all colors. When you compare this idea to the Hue Chart, there is no option available for all colors or zero colors. So the hue value reported may not align with what we perceive the color to be.
Downloading and Opening VEX GO Projects
In some of the Labs, students will be given projects to print data to the Print Console. These projects should be downloaded prior to starting the lesson, so they can be opened and used when needed. You may choose to download them for students, or to have students download them themselves. The files for the projects are located in the materials list. To learn more about how to load and open downloaded projects see these device-specific VEX Library articles: