
Sensors are fundamental to the efficient and productive use of robots in industrial manufacturing. Sensors collect data from the environment which can be used by the robot to make decisions in real time, allowing processes to be fully automated.
In this Lesson, you will:
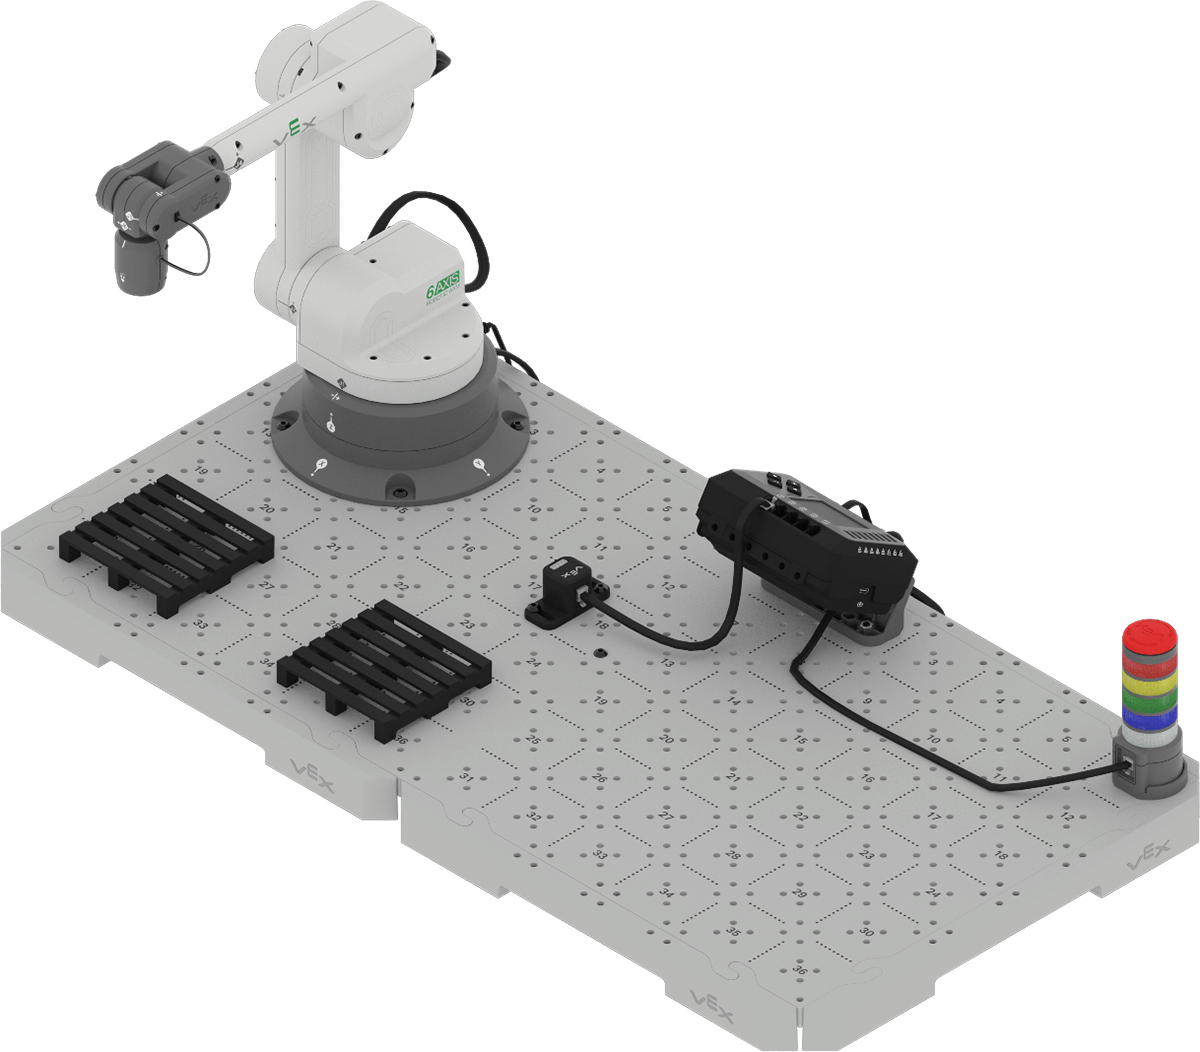
- Follow build instructions to add the Optical Sensor to the Brain CTE 6-Axis Arm Base.
- Learn what a sensor is.
- Learn what the Optical Sensor reports and how it functions.
- View Optical Sensor data in the Devices Screen on the Brain.
At the end of this Lesson, you will manually move the 6-Axis Arm with an object over the Optical Sensor, to develop an understanding of the data it reports and how to view it.
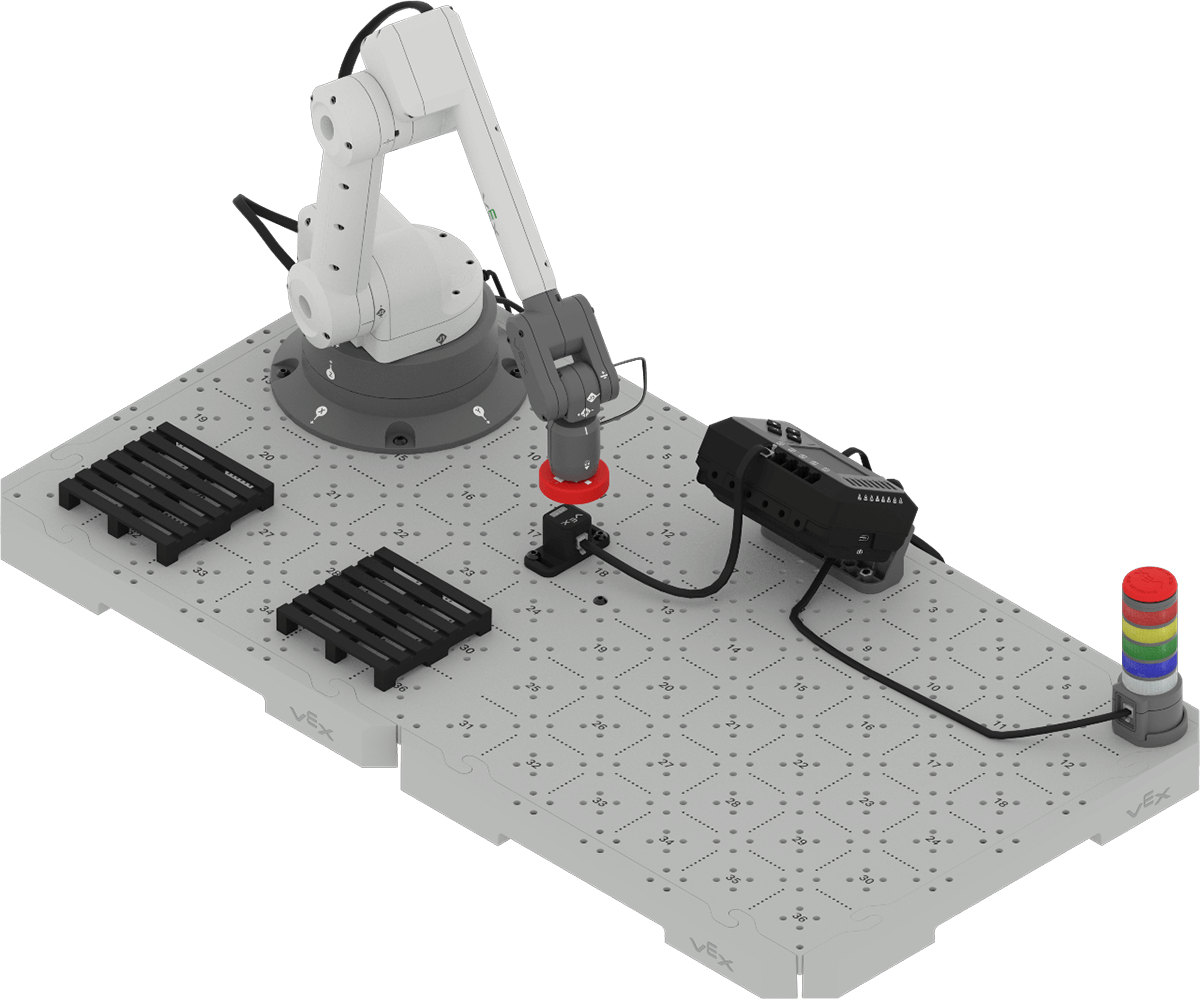
Adding the Optical Sensor
Follow the steps below to add the Optical Sensor to your Brain CTE 6 Axis Arm Base.
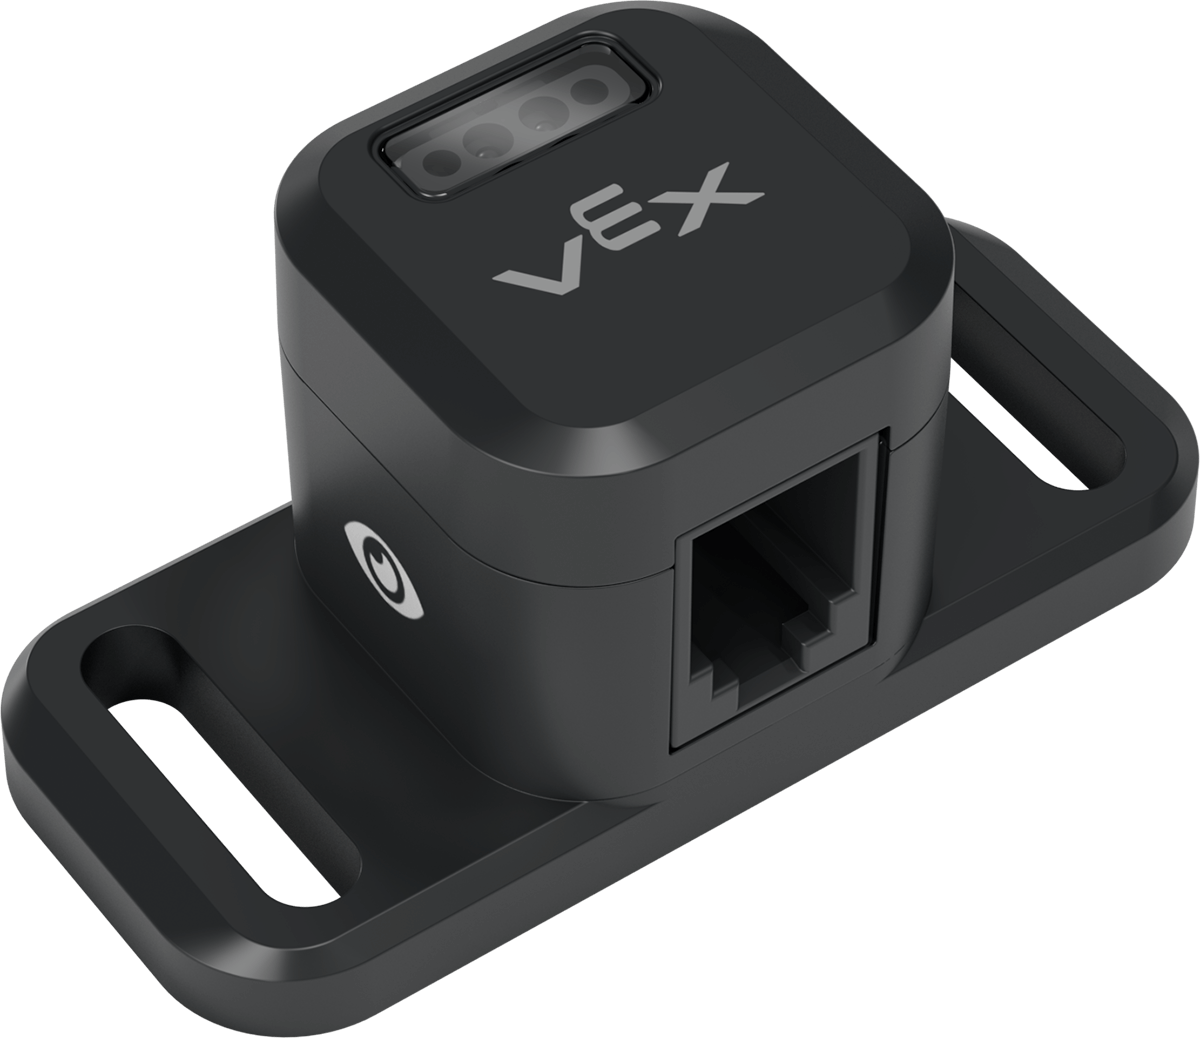
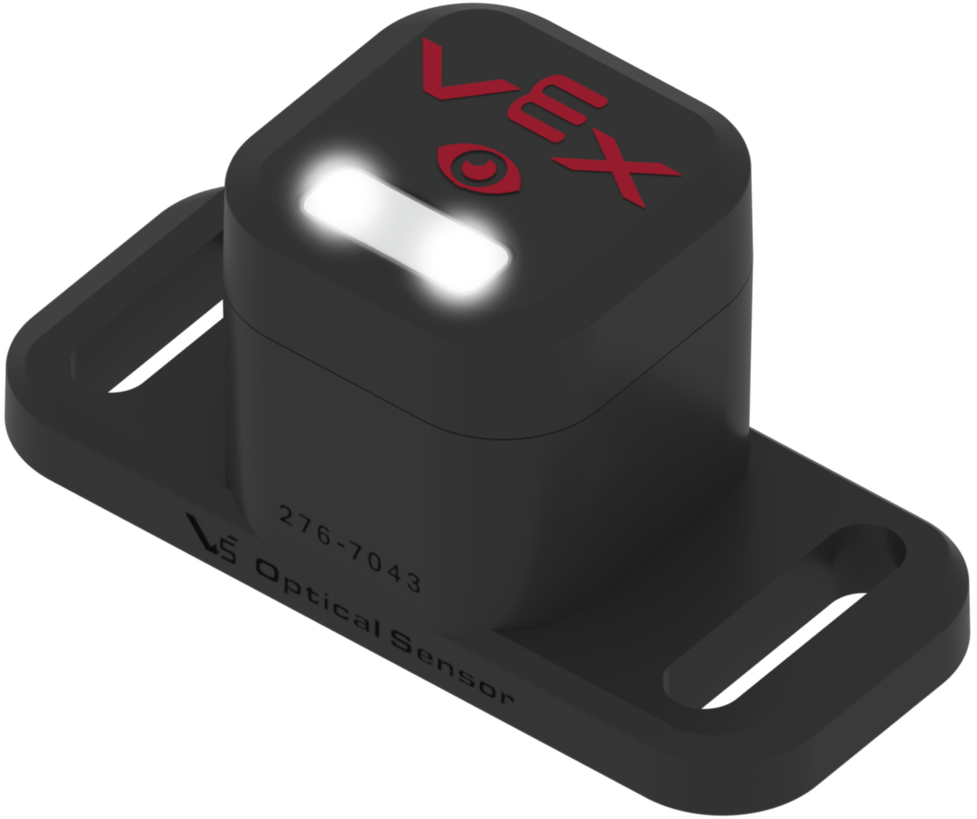
The Optical Sensor
What is a Sensor?
A sensor is a device that collects data from the environment, and reports it in a form that can be read and understood. We interact with sensors constantly in our daily lives. For example, ultrasonic sensors on cars help keep us safe, by collecting data on the traffic around our vehicles and triggering an alert when a car is in our blind spot. Proximity sensors on faucets help save water by detecting whether your hands are within a certain distance, causing the water to start and stop running. On an industrial robot, sensors are essential to the effective automation of complex processes, such as detecting manufacturing defects, aligning parts for assembly, and sorting, stacking and palletizing objects.
How the Optical Sensor Works
Data from the Optical Sensor can be used in a VEXcode project for the CTE Workcell to make decisions based on color. The Optical Sensor can report the hue value, proximity, and brightness of the sensor's environment.
The Optical Sensor does not detect color. Rather, it detects if an object is near, and if so, displays the digital hue value of that object.
The sensor works by emitting a white light. The light is then reflected back by the detected object, and the Optical Sensor measures the intensity of the colors in the reflected light.
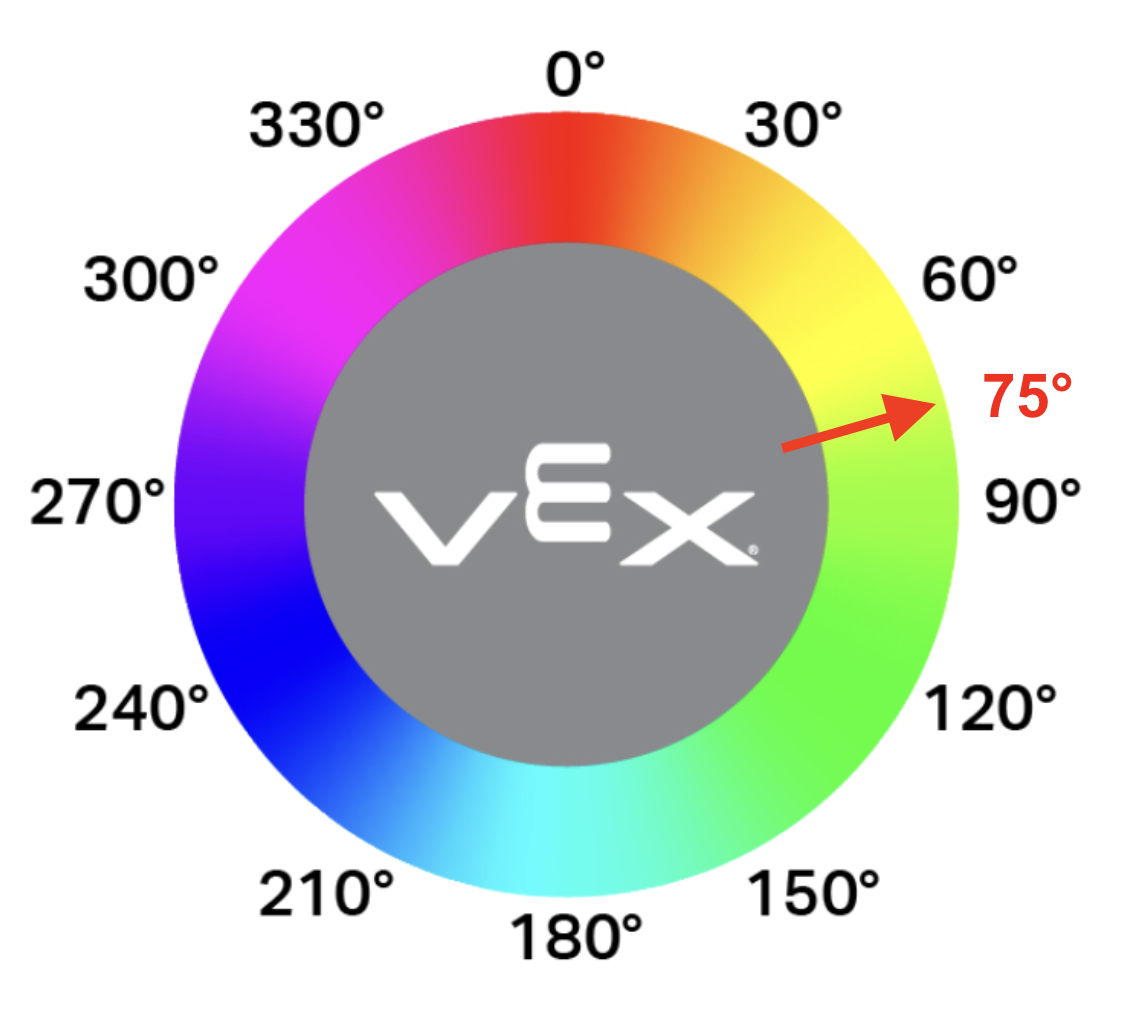
The sensor performs a calculation based on those levels of intensity to determine a hue value, which can be viewed on the EXP Brain's Devices Screen.
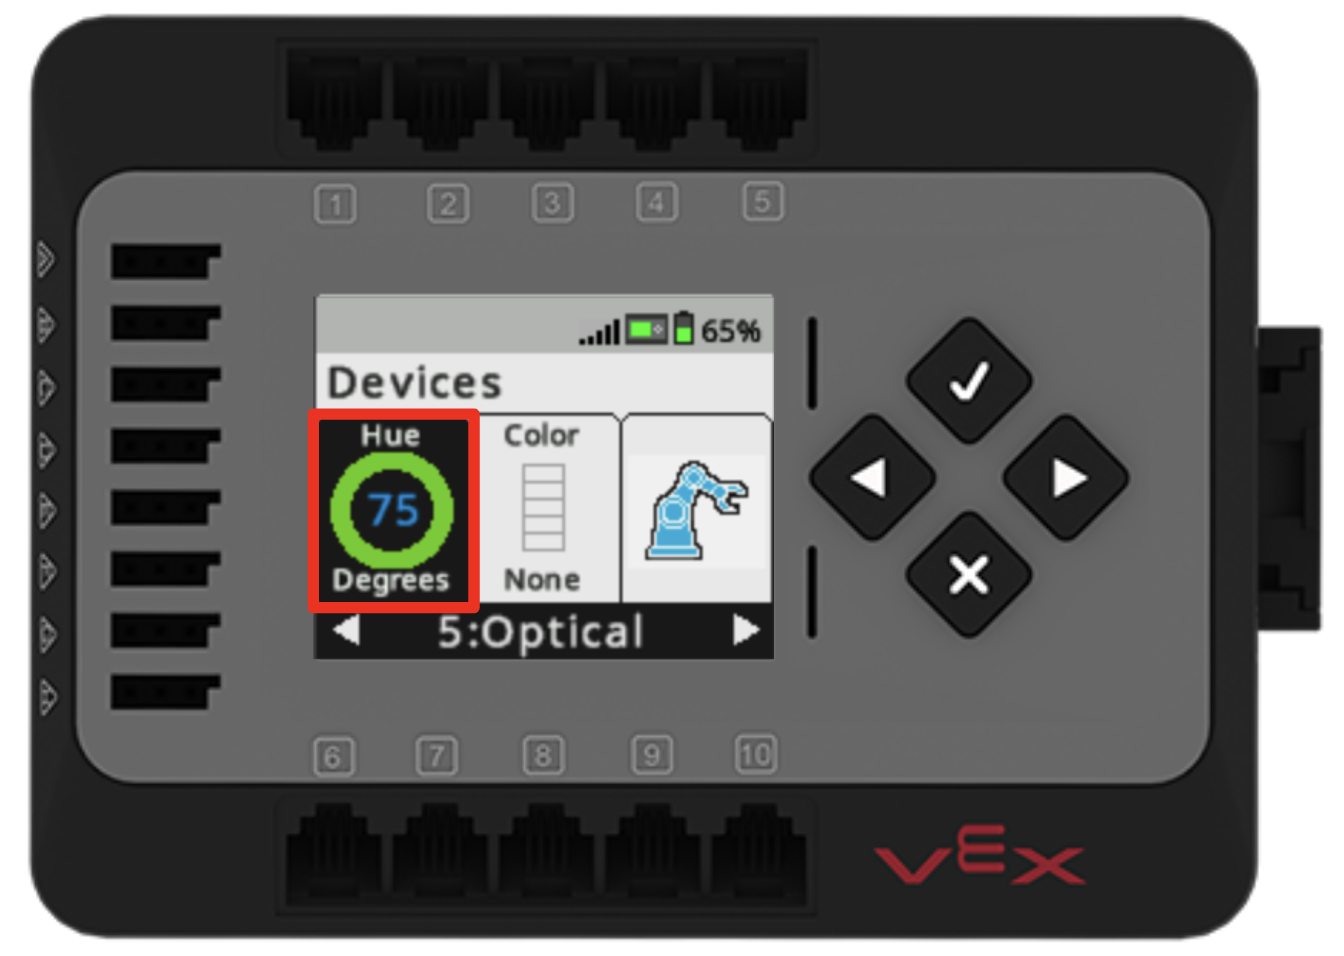
The hue value can be interpreted by using a hue chart to determine a color. In the image from the Brain Screen in the line above, the reported hue value is 75 degrees. On the hue chart, 75 degrees would be directly between 60 degrees and 90 degrees, so the corresponding color is light green.
Notice that the color on the hue wheel aligns to the colored ring around the hue value on the Devices Screen.
Ambient Light and the Optical Sensor
Because color is reflected light, the ambient light (light present in the area where the sensor is used) will affect the hue value reported by the sensor. For example, a green Disk may report the number '57', which falls into the 'yellow' area on the Hue Chart. This is not due to a sensor malfunction, but instead due to the ambient light present around the sensor. The hue values may read differently depending on where the sensor is positioned in the classroom. Being seated near a window, for example, or on a particularly cloudy day, may change the way the sensor reports hue value data.
The Optical Sensor is equipped with LED lights to provide a light source that is consistent regardless of ambient light.
For Your Information
The Devices Screen on the EXP Brain allows you to see all of the data reported by the Optical Sensor. When the Optical Sensor is selected in the Devices Screen Dashboard, use the Checkmark button to scroll through the screens displaying hue, brightness and proximity data. View the video below to view the different displays on the Devices Screen.
The video begins with the Hue value at 73 degrees surrounded by a light green circle. When the Checkmark button is selected, the display changes to read ‘Brightness 75 Percent’. When pressed again, the display reads ‘Proximity Far’. When pressed a third time, the display changes to open all of the data from the Optical Sensor on one screen, including the LED value set to 0.
The Optical Sensor's LED lights can be turned on and off from the screen that shows all of the Optical Sensor data together. Press the Left Arrow button on the Brain to turn the LED lights on or off. View the video below to see the LED value change from 0 to 100, indicating that the LED lights have been turned on, and notice the hue value updating accordingly. The LED lights are then turned off at the end of the video.
Activity
Now that you have learned about the Optical Sensor and how it works, it is time to explore it further by viewing Optical Sensor data in the Brain's Devices Screen. In this Activity, you will manually move the 6-Axis Arm while holding a red Disk over the Optical Sensor and then record your observations about the data the sensor is reporting. View the video below to see how to complete the steps of the Activity listed below that are related to moving the 6-Axis Arm and viewing data from the Devices Screen.
Activity: Manually move the 6-Axis Arm over the Optical Sensor and up and down along the z-axis to make observations about the sensor data reported in the Brain's Devices Screen.
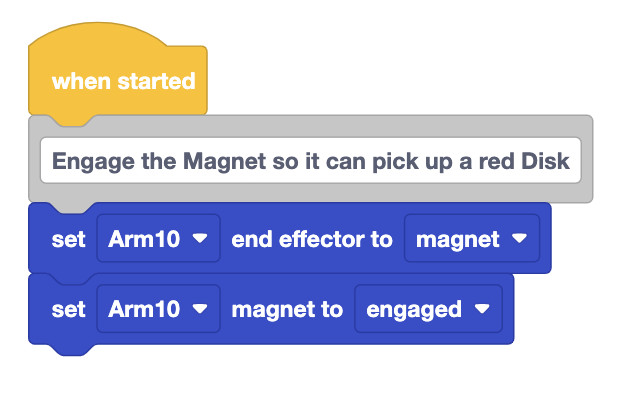
- First, build the VEXcode project below, and download the project to the Brain. This project will allow the Disk to remain attached to the Magnet when the project is stopped, to make it easier to manually move the 6-Axis Arm.
- Run the project, and manually attach a red Disk to the Magnet on the 6-Axis Arm.
- Stop the project.
- Move the 6-Axis Arm with the Disk attached over the Optical Sensor. Observe the data reported by the Optical Sensor on the Brain's Devices Screen as you slowly move the 6-Axis Arm down the z-axis towards the sensor, and then away from the sensor.
- Record the answers to the following questions in your engineering notebook:
- How does the hue value change as the Disk gets closer to the sensor? Why do you think this is happening?
- How does the hue value change as the Disk gets further away from the sensor? Why do you think this is happening?
- What is the numerical hue value reading when the color reported on the Devices Screen matches the color of the Disk?
- When you have found the point on the z-axis where the hue value reading matches the color of the Disk, hold the 6-Axis Arm in that position.
- Select the Arm option in the Devices Screen to observe the coordinate data of this location. Record this x, y, z-coordinate in your engineering notebook. This will tell you where the Disk needs to be positioned for the Optical Sensor to correctly report the hue value, under the current lighting conditions.
- Repeat this process with the Optical Sensor's LED lights on, answering the same questions in your engineering notebook.
- How does the data differ with the LED lights on? Why do you think that is?
- Did the LED lights change the answers to the questions above? Record your answer to this question in your engineering notebook as well.
Check Your Understanding
Before moving on to the next Lesson, ensure that you understand the concepts in this Lesson by answering the following questions in your engineering notebook.
Check Your Understanding questions > ( Google Doc / .docx / .pdf )
Select Next > to move on to the next Lesson to learn how to sort a Disk by color.