Reading Sensor Values
In this Lab, the Optical Sensor as well as three Line Trackers are used to trigger different movements of the conveyors. To be able to program the sensors, a better understanding of their limits and outputs are needed.
- Download and run the project.
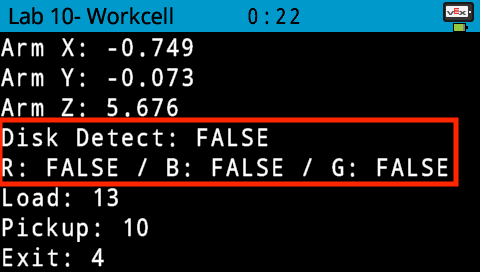
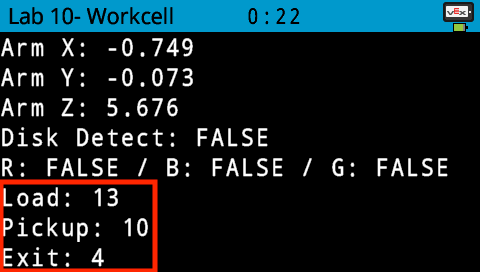
- View the V5 Brain’s screen. Notice the updated dashboard to account for the new sensor values on the Workcell.
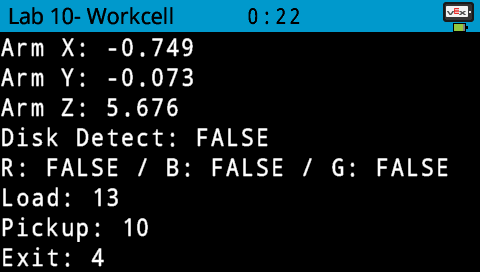
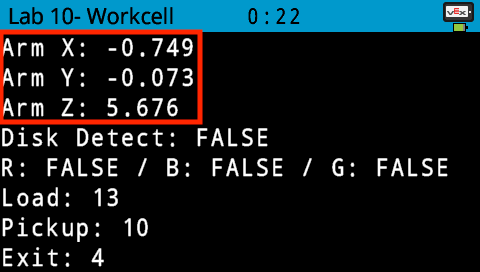
- The Sensor values are displayed. The first values to be displayed are the arm mounted on the VEX V5 Workcell’s (x, y, z) coordinates.
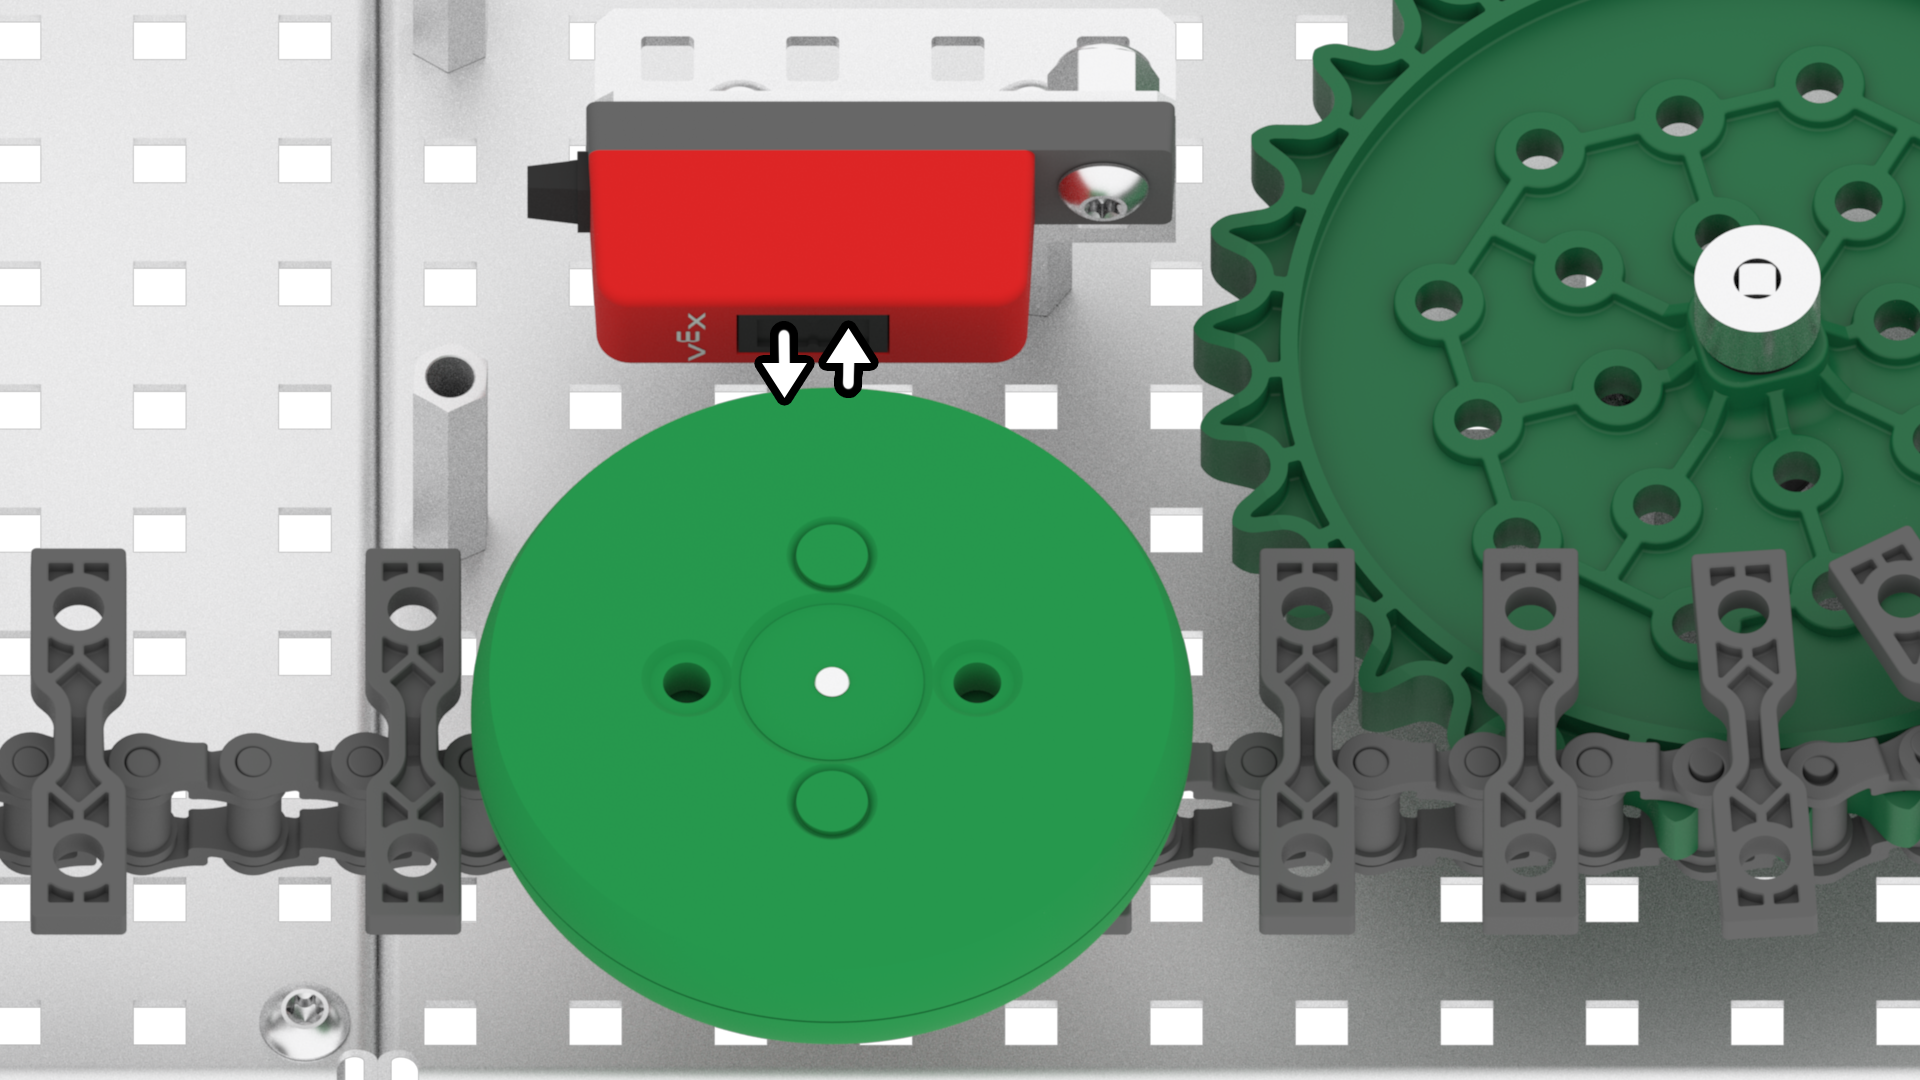
- The second value to be displayed is if a disk is detected by the Optical Sensor and if so, what color the disk is. The Optical Sensor contains an infrared sensor and that is used to determine if an object is present or not. If an object is detected as present, the Optical sensor can then determine what color the object is.
Note: for more information about the Optical Sensor, view the Optical Sensor article from the Knowledge Base.
- Place a red disk in front of the Optical Sensor. Notice that the ‘Disk Detect’ value reports ‘TRUE’ and R for ‘Red’ also reports ‘TRUE.’
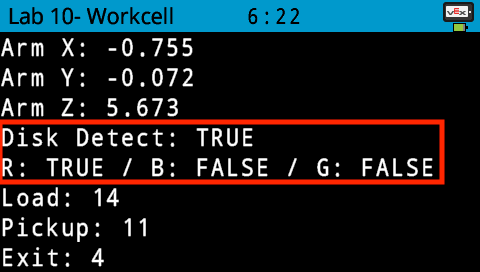
Note: only one of the three colors can report ‘TRUE’ at one time. Thus, when detecting a disk, one color should be ‘TRUE’ and the two other colors should report ‘FALSE.’
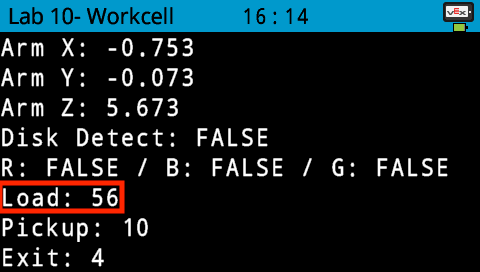
- The third values to be displayed are the outputs of the Line Trackers. These outputs are the percentage of light that is being reflected back from the Line Tracker.

- Place a disk in front of the Load Sensor. Notice that the values increase from 13% to approximately above 30%. These threshold values can be used to program the Load Sensor to trigger certain movements of the conveyors. Once the Sensor detects a value below or above a certain threshold value, the conveyors can be triggered to stop or begin moving.
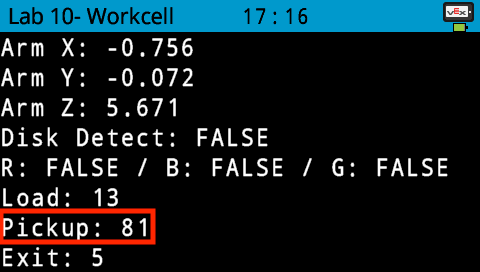
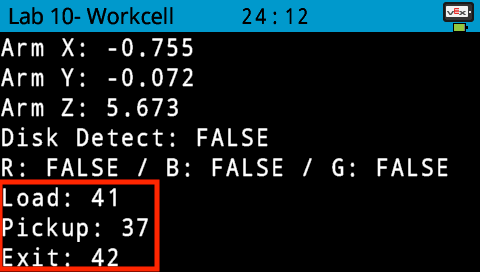
- Notice that the Line Trackers do not always display the same values. Place a disk in front of the Pickup Sensor. Notice that the value displayed is not the exact same as the Load Sensor. Each of the three Line Trackers can display different values. This can depend on different conditions such as how close the disk is to the Sensor or the amount of light in the environment.
- In your Engineering Notebook, record the three Line Tracker values with no disks in front of them. These are the lower end of the Threshold Values.
- Place a disk in front of each of the three Line Trackers and record these values in your Engineering Notebook.
- These values are the higher end of the threshold and will be needed to determine when to trigger certain conveyor movements later in the project.
- Stop the project.