
Play
Part 1 - Step by Step
- InstructInstruct students that they are going to manually move the Code Base across the surface of the bridge, to monitor and record data about the different sections. They will record data about the eye light, the section of the bridge, the hue value, and the color on the hue chart on the Data Collection Sheet. Watch the video below to see an example of a hand moving the robot across the colored pieces on the Tile to view the hue of each piece. In one corner a GO Blocks project reads 'When started, set eye light off', and in the other corner the 'Eye hue in degrees' sensor data is shown updating live.
Video file
- ModelModel how they will view and record the data from the Eye Sensor while the robot is moving along the bridge. Use one group's setup, and be sure that students can see the Monitor in VEXcode GO clearly. You can have students gather around the setup, or project VEXcode GO for the whole class to see.
- Model for students how to monitor data from the Eye Sensor in VEXcode GO. (Students will then follow the steps to monitor and record data for the remaining sections in their groups.)
- Begin by showing students how to connect the Brain on their Code Base to their device in VEXcode GO. Because connection steps vary between devices, see the Connecting articles of the VEXcode GO VEX Library for specific steps to connect the VEX GO Brain to your computer or tablet.
- They will also need to configure VEXCode GO for the Code Base. If necessary, model the steps from the Configure a Code Base VEX Library article and ensure students can see the Drivetrain blocks in the Toolbox.
- Note that in order for the Eye Sensor to be connected, VEXcode GO must be configured for the Code Base and the the Brain must be paired and connected to VEXcode GO.
-
Drag the Set eye light block into the Workspace and attach it to the When started block.
Add Set eye light block -
Use the dropdown to set the eye light to 'off'. Adding this block to the project is necessary because the eye light's default setting is 'on', and we are going to collect Eye Sensor data with the light off first. Explain to students that they will be collecting data with the light on in Play Part 2.
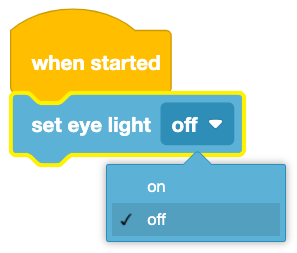
Set the eye light to 'off'
- Model for students how to add Eye hue in degrees to the Monitor in VEXcode GO.
-
Select the Eye hue in degrees block in the Toolbox, and drag and drop it into the Monitor icon in the Workspace, as shown in this video.
Video file -
Once the block is added, the Monitor will automatically open, and students can see the Eye hue in degrees in the Sensors section, as shown here.
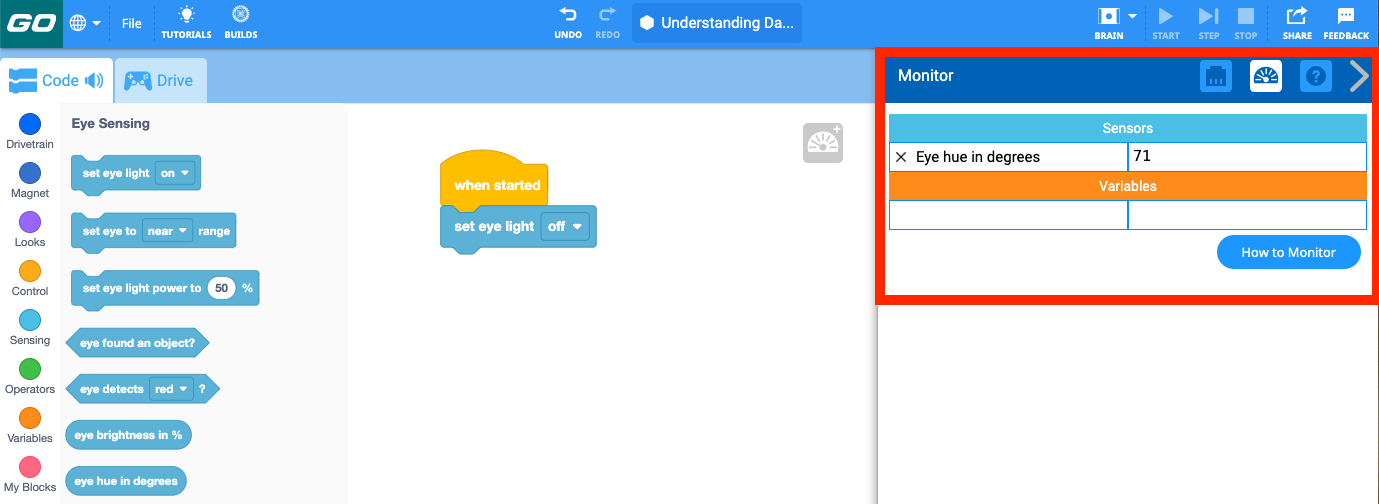
Monitor in VEXcode GO - Note that there may be a default value pre-populated in the Monitor for Eye hue in degrees. This value will change once the project is started.
-
- Once students have built their project, have them name their project as Hue value and save it to their device. See the Open and Save section of the VEXcode GO VEX Library for device-specific steps to save a VEXcode GO project.
- Show students how to connect the Brain on their Code Base to their device in VEXcode GO. Because connection steps vary between devices, see the Connecting articles of the VEXcode GO VEX Library for specific steps to connect the VEX GO Brain to your computer or tablet.
-
Select Start to start the project.
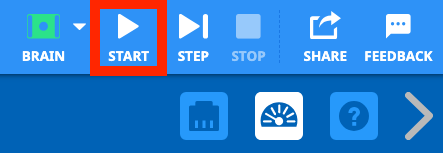
Select Start -
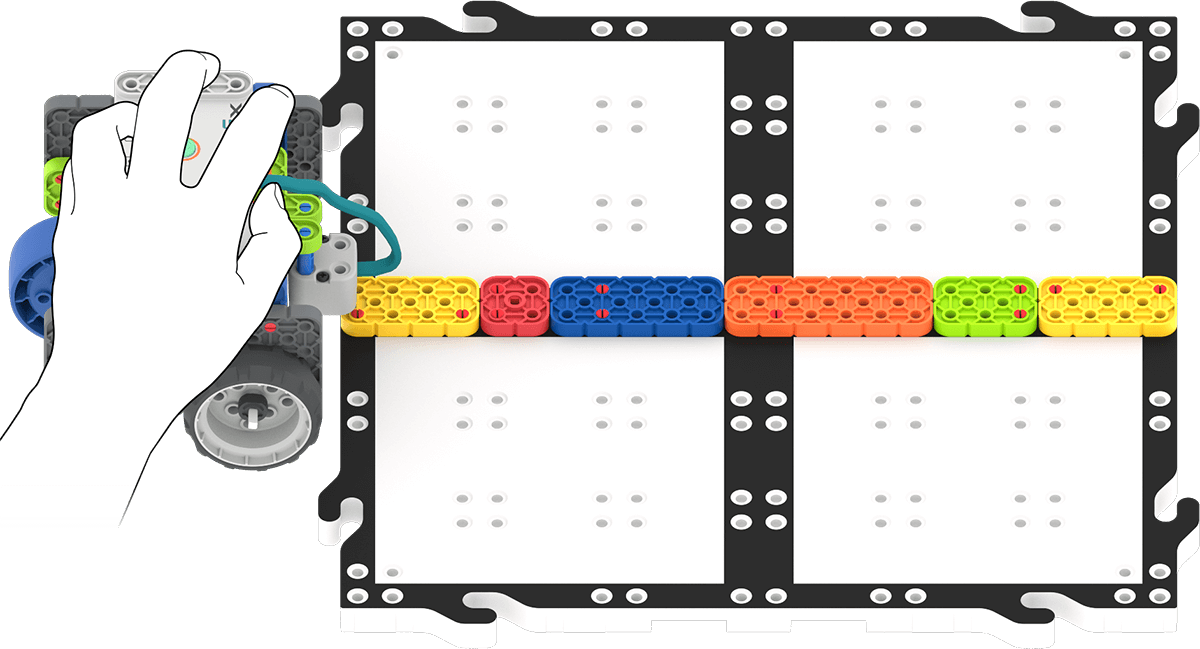
Model for students how to hold the Code Base in order to monitor the value for the first bridge section. Position the Code Base wheels against the Tile, with the Eye Sensor over the first Yellow Beam, as shown here.
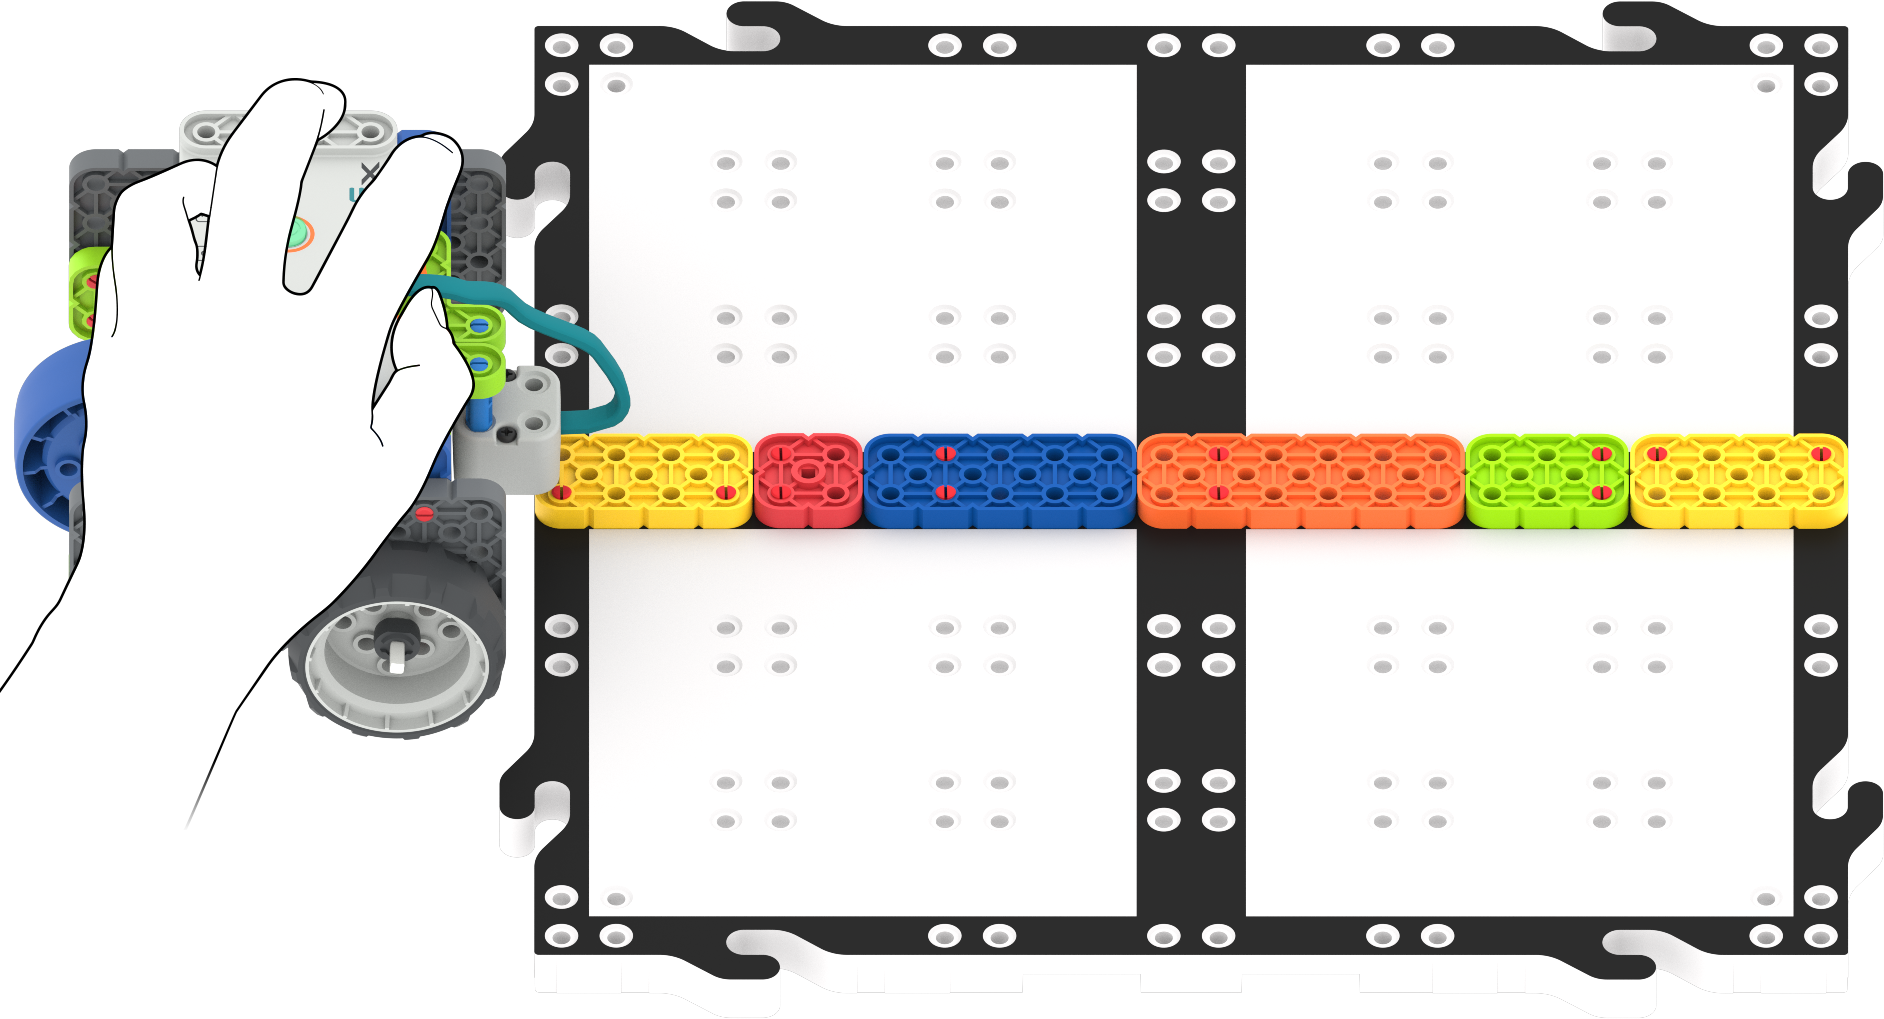
Bridge setup - Call students' attention to the hue values reported in the Monitor, and how they change in real time as the robot moves. If students need an additional visual of this process, show them the video in the 'Instruct' step of Play Part 1 again.
- Model for students how to record the data on the Data Collection Sheet. Students will record data about the eye light, the section of the bridge, the reported hue value, and the color on the hue chart.
-
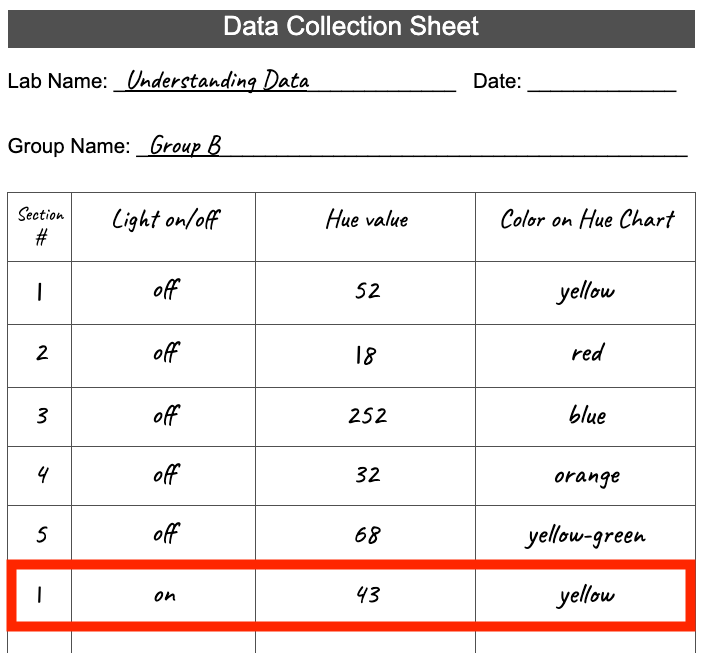
Record the light and hue value data for the first section, as shown here.
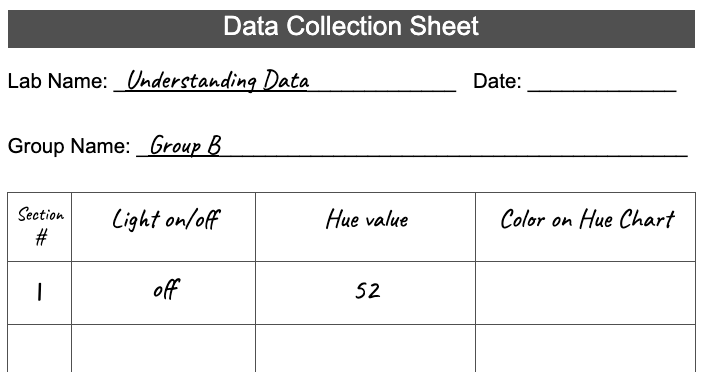
Record the data for section 1 -
Use the hue chart to determine the color that aligns to the reported hue value.
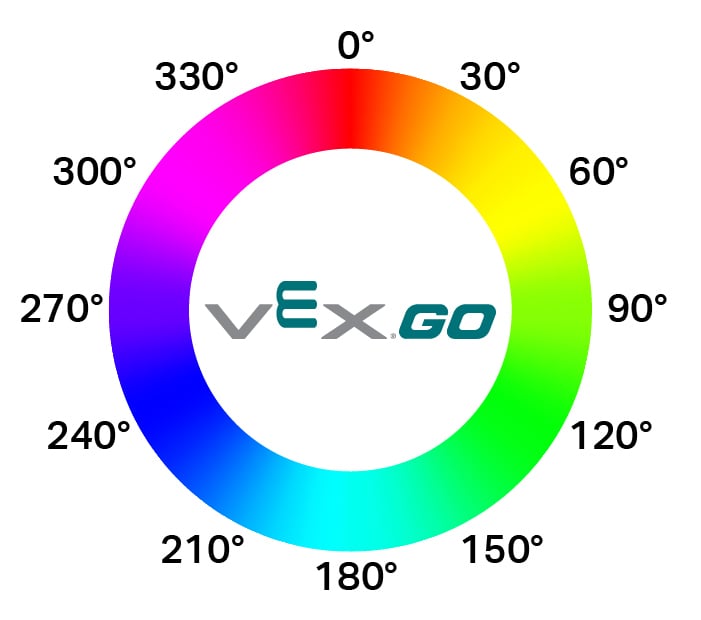
Hue chart -
Record the color on the Data Collection Sheet, as shown here.
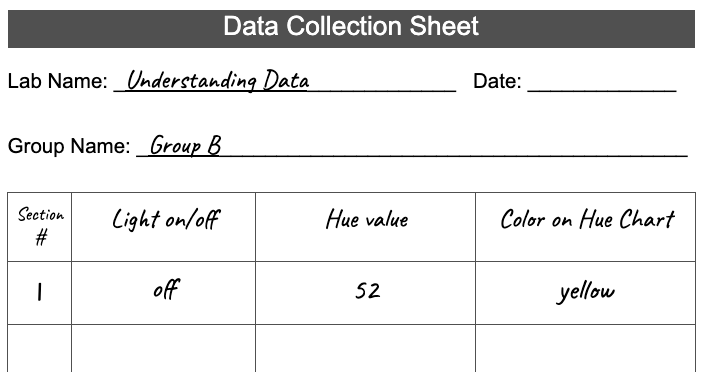
Record the color from the hue chart -
After students have collected their data, they should press the Stop button in the Toolbar to stop the project.
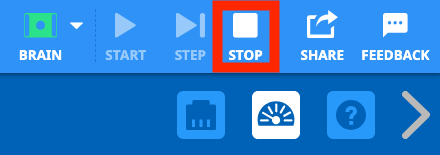
Press 'Stop' to stop the project
-
- Model for students how to monitor data from the Eye Sensor in VEXcode GO. (Students will then follow the steps to monitor and record data for the remaining sections in their groups.)
- FacilitateFacilitate conversations with students as they monitor and record the data about hue values and colors for sections 2, 3, 4, and 5 in their groups.
To help students think more about the functionality of the Eye Sensor, ask them about the values they see in the Monitor.
- Why do you think the hue values in the Monitor change so frequently?
- What do you notice about the position of the Eye Sensor in relation to the value reported? Does it change when it is closer or further away from the bridge, or on different areas of a section? Why do you think that is?
Encourage students to think about the connection between color and light, by asking questions such as:
- Do you think the hue values reported by the Eye Sensor would change if we turned the lights off in our classroom? Why or why not?
- What if we went outside into the bright sunshine? Do you think that would make a difference? Why or why not?
Help students think about the similarities and differences between how the Eye Sensor reports color related data, and how they perceive colors by asking questions like:
- How does the robot report 'color' information?
- How is that different to how we report information about the colors that we see around us?
- We can see many shades of colors, can the robot also distinguish different shades of color? How do you know?
If students complete the Data Collection Sheet early, and need an additional challenge, have them explore the Eye Sensor data reported for their bridge in a darker area of the classroom. Is the data different when there is less light present?
Teacher Tip: Students may notice that the reported hue values for black, white, or gray (like the colors on the Tile) is unreliable. This is because black is essentially the absence of color, and white is essentially the combination of all colors. Shades of black and white are not able to be read accurately by the Eye Sensor, as it cannot detect the presence or absence of all color effectively. Therefore, the hue value reported may not align with what we perceive the color to be.
- RemindRemind students to take turns as they are monitoring and recording the data. One student can hold the robot, while the other records the data for the first section, then they can trade off for the next section. Be sure that each student gets an opportunity to both manipulate the robot and record the data successfully.
- AskAsk how they think the Eye Sensor could be used in a real life application. What are some situations in which being able to detect and report hue values, or color data, could be useful? Can you think of something at school or at home, where you could use the Eye Sensor to help you solve a problem?
Mid-Play Break & Group Discussion
As soon as every group has recorded the data for all five sections of the bridge in their Data Collection Sheet, come together for a brief conversation.
- Have students share the hue values and color data that they recorded for each section of the bridge. While the colors on the hue chart are likely to be the same, the recorded hue values will likely have some variability.
- Have a conversation about why that variability exists.
- What did you notice about the reported values in the Monitor while you were gathering your data?
- We all have the same exact setup, why do you think our hue values aren't exactly the same?
- We learned that the Eye Sensor measures the reflected light in order to report a hue value. What do you notice about the light in different parts of our classroom? Or even on different parts of your bridge?
- Guide students to make a prediction about whether or not their data would change if the light was different.
- What if we added more light to where the Eye Sensor is working? Do you think that would affect the reported values? Why or why not?
-
Have each group write their predictions on the bottom of the data collection sheet, as shown here.
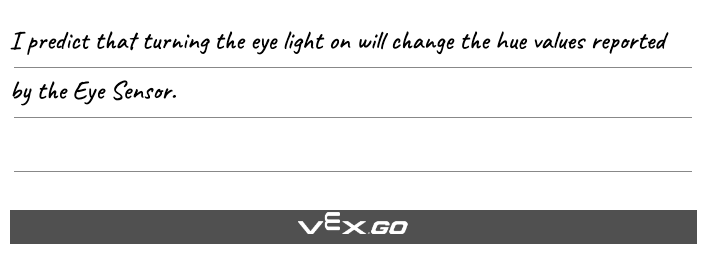
Write your prediction
Part 2 - Step by Step
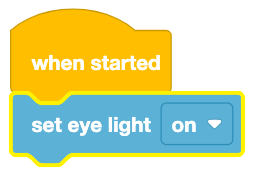
- InstructInstruct students that they are now going to test their prediction, and turn the Eye light on to add more light. Students will follow the same process they did in Play Part 1, but first they will change their project to turn the Eye light 'on', so the light on the sensor shines on the surface of the bridge. Watch the video below to see an example of a hand moving the robot across the colored pieces on the Tile to view the hue of each piece, this time with the eye light on. In one corner a GO Blocks project reads 'When started, set eye light on', and in the other corner the 'Eye hue in degrees' sensor data is shown updating live.
Video file
- ModelModel for students how to turn the Eye light on, and gather data to test their predictions. Use one group's setup, and be sure that students can see the Monitor in VEXcode GO clearly. You can have students gather around the setup, or project VEXcode GO for the whole class to see.
-
Use the dropdown of the Set eye light block to set the eye light to 'on', as shown here.
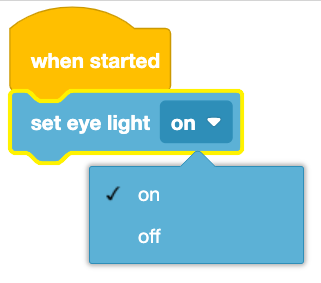
Set eye light to 'on' - Model for students how to monitor the data for the first section of the bridge, with the eye light on.
-
Show students how to hold the Code Base with the Eye Sensor over the first section of the bridge, with the light shining on the beam, as shown here.
Code Base with Eye Light on in starting position - Call students' attention to the values reported in the Monitor, and how they change in real time as the robot moves.
-
- Model for students how to record the data on the Data Collection Sheet. Students will record data about the eye light, the section of the bridge, the reported hue value, and the color on the hue chart.
- Record the hue value for the first section, as shown here.
- Use the hue chart to determine the color that aligns to the reported hue value.
-
Hue chart -
Record the color on the Data Collection Sheet, as shown here.
Record the color for section 1 with the eye light on -
After students have collected their data, they should press the Stop button in the Toolbar to stop the project.
Press 'Stop' to stop the project
-
- FacilitateFacilitate conversations about the effect the eye light is having on the reported values, as students are monitoring and recording data for the remaining sections of the bridge with the eye light on. Once students have recorded the data with the eye light on, they should determine if their prediction is supported by the data.
Help students compare the data they are collecting with the eye light on to what they collected with the light off, by asking questions like:
- What do you notice about the reported hue values with the eye light on? Are they different from the values you recorded with the light off?
- Why do you think the values are different?
- Are the colors on the hue chart different with the eye light on? Why or why not?
Facilitate conversations about whether the data students are collecting supports their predictions. Ask questions like:
- What was your prediction? Why did you make that prediction?
- Does your data support your prediction? Why or why not?
- Have students answer this question on the data collection sheet, below their prediction, so that they can use their answer to participate in conversations in the Share section.
Encourage students to think about how the data from the Eye Sensor is affected by light. Ask questions like:
- What other data could you collect to support the prediction that the amount of light affects the data reported by the Eye Sensor?
- How do you think gathering data in a darker environment would affect the data? Why?
- What conclusions can you draw about light and color from the data you've collected today?
If students finish monitoring and recording data with the eye light on early, and need an additional challenge, have them add the Set eye light power block to their project.
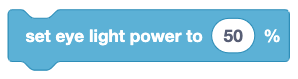
Set eye light power block Students can change the parameter to raise or lower the light power. Have them run their project and observe and record the data. They can make a prediction about how they think raising or lowering the light power will change the reported hue values, then test that prediction to answer the question of how is the data reported by the Eye Sensor affected by changing the light power?
- RemindRemind students that they should be evaluating whether their prediction was correct once they have collected their data. If it was, great! Encourage them to gather additional data to support their prediction. If it was not, that's okay too, but encourage to figure out what was different between what they thought was going to happen, and what the data showed.
- AskAsk students about how a sensor like the Eye Sensor could be used in indoor or outdoor situations. How might the light of the sun, classroom light, bright lights, or nighttime darkness affect what the sensor can be used for?