
Play
Part 1 - Step by Step
- InstructInstruct students that they are now going to use the data they collected to find the size of the crack. They are going to use the Data Points of the Crack table they filled out in Lab 2 to figure out the size and category.
In Lab 2, the graph of distance and hue values showed the section of the bridge that had a crack. Now, we can use the distance values we recorded to calculate the size of the crack in the bridge. Knowing whether the crack in the bridge is 'small', 'medium', or 'large' can help us categorize it as 'Safe', 'At Risk', or 'Dangerous.'
Example Bridge Inspection Report page - ModelModel how to complete the Bridge Inspection Report to figure out the size and category of the crack. Using the data they recorded in Lab 2, students will calculate the size and category of the crack. You can demonstrate this process for students, or have them follow along with you as a guided demonstration.
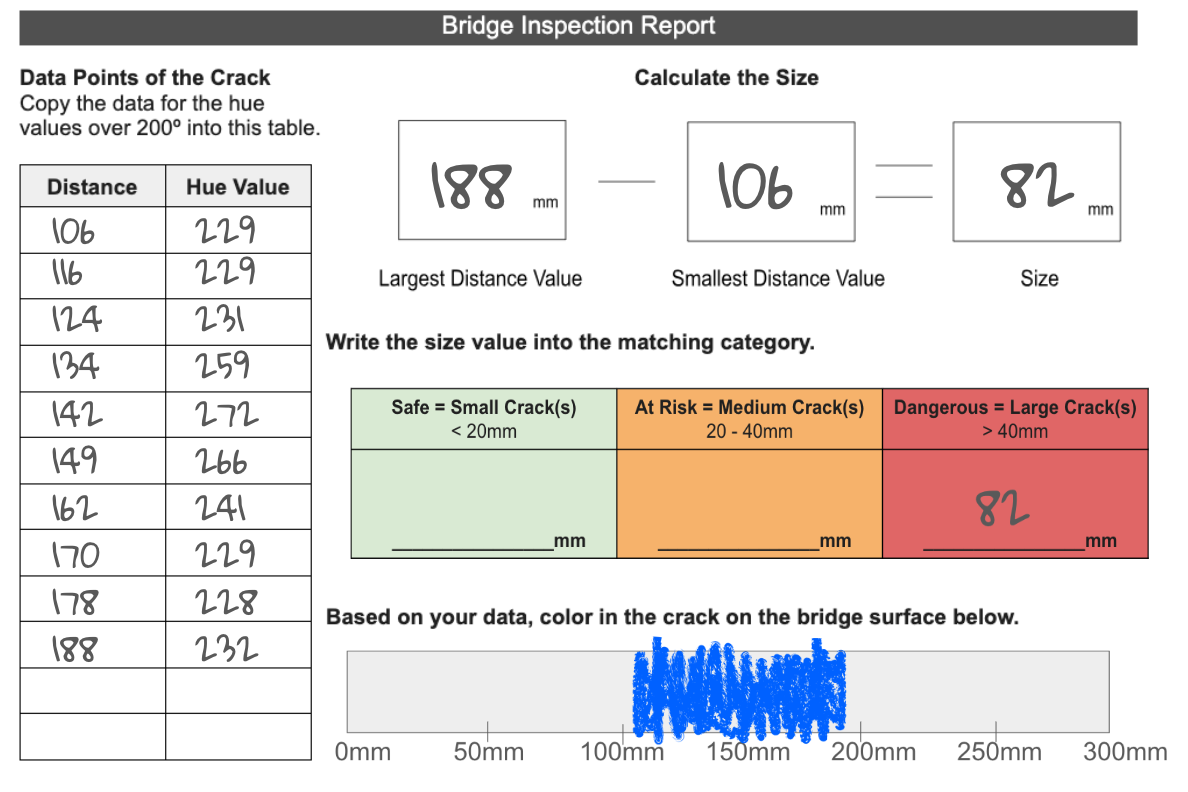
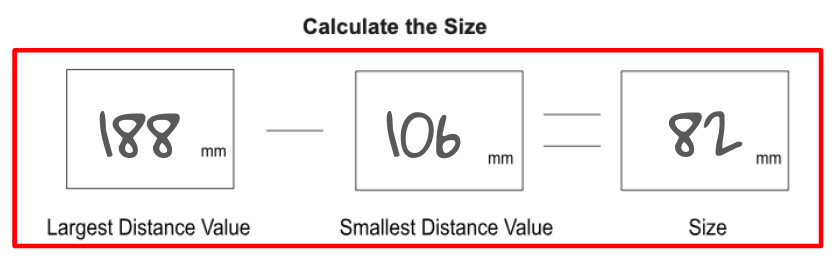
- Model for students how to calculate the size of the crack using the distance values. To find how far the crack extends, the distance between the start of the crack (the smallest distance value) and the end of the crack (the largest distance value) can be calculated.
-
Students will subtract the smallest distance value from the largest, to find the size of the crack in the bridge.
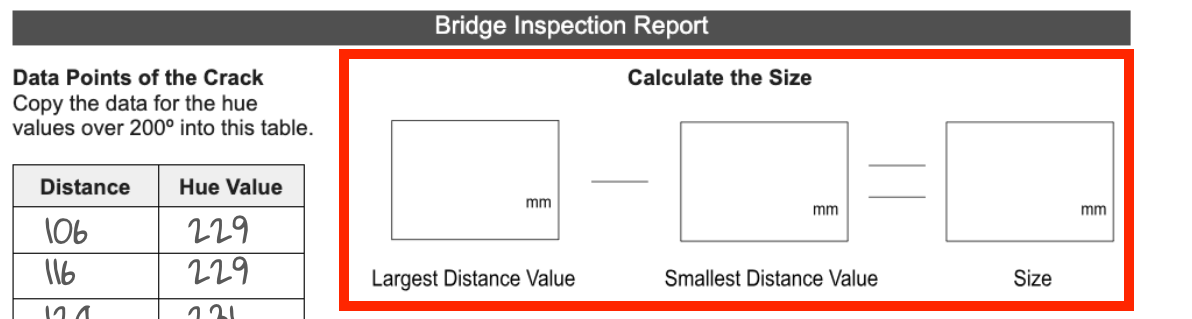
Size calculation section -
Have students write the largest distance value from their table into the space labelled 'Largest Distance Value'.
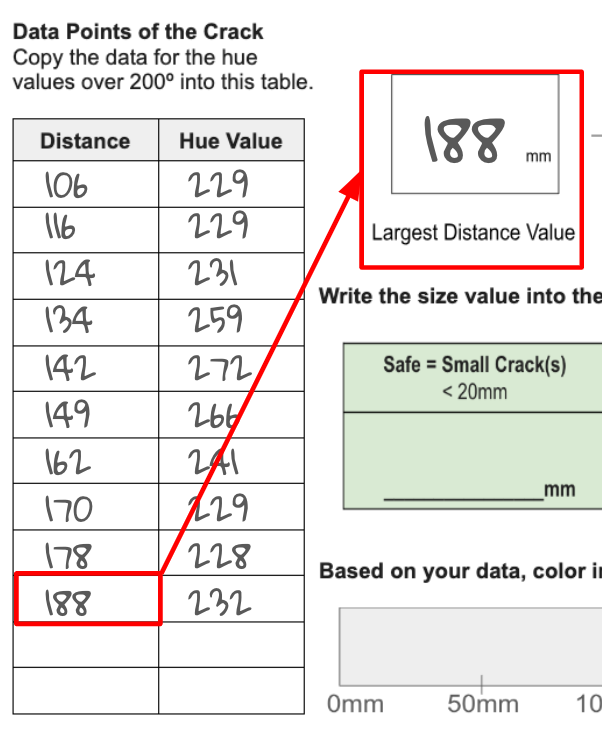
Write the largest distance value -
Have students write the smallest distance value from their table into the space labelled 'Smallest Distance Value'.
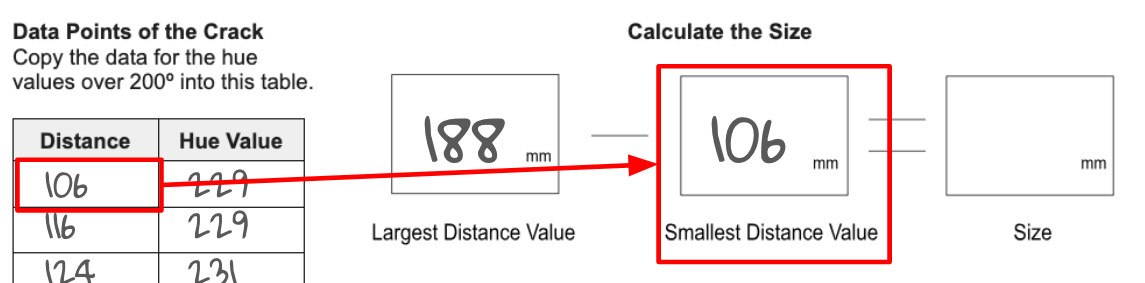
Write the smallest distance value -
Have students complete the calculation to find the size of the crack, based on the distance data.
Complete the calculation
-
-
Now that students know the size of the crack, they can categorize it as 'Safe', 'At Risk', or 'Dangerous'.
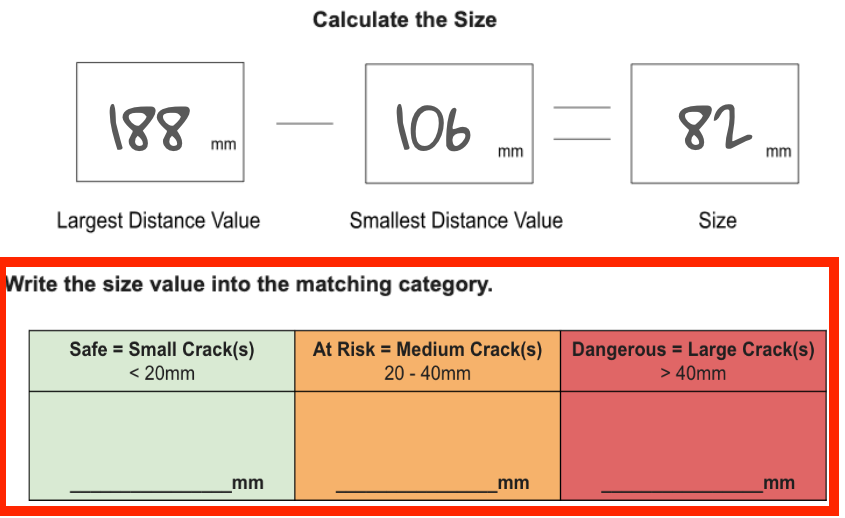
Size categories - Ask students which category the size they calculated corresponds to. Is the value they found 'small', 'medium', or 'large'?
-
Have students write the size into the appropriate category, as shown here.
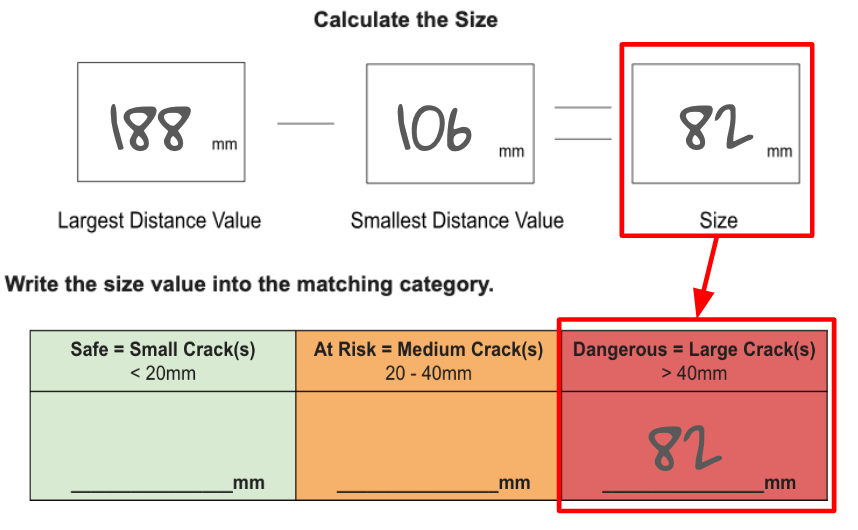
Write the size value in the matching category
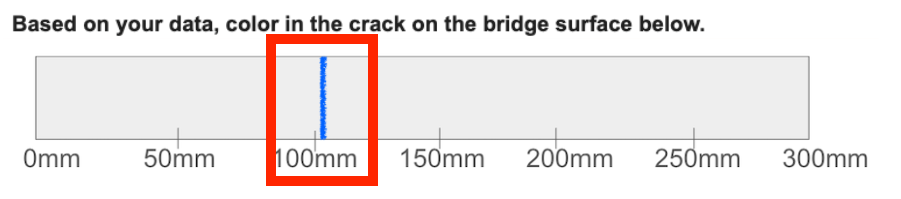
- Finally, have students represent the data of the crack, by coloring in the distance of the crack on the bridge surface.
-
Mark the smallest distance value on the bridge surface. Remind students that they should approximate the distance value – it does not need to be exact.
Mark the smallest distance value -
Mark the largest distance value on the bridge surface.
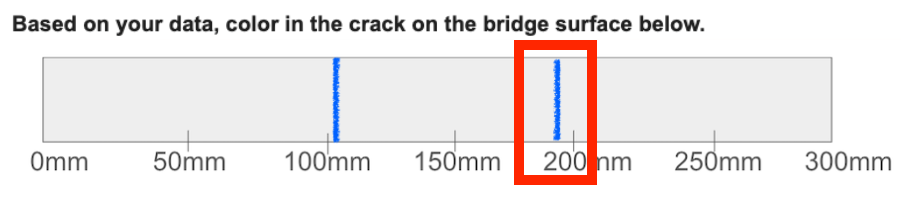
Mark the largest distance value -
Color in the space between to show the size of the crack on the bridge surface.
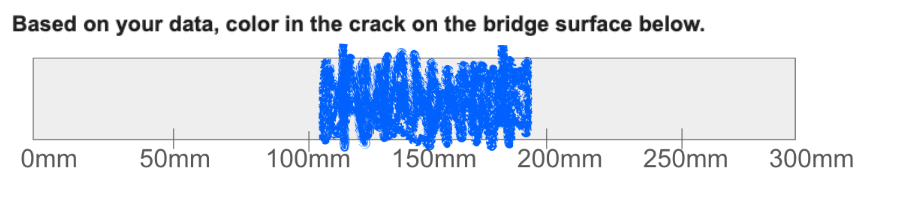
Color in to show the crack on the bridge surface
-
- Model for students how to calculate the size of the crack using the distance values. To find how far the crack extends, the distance between the start of the crack (the smallest distance value) and the end of the crack (the largest distance value) can be calculated.
- FacilitateFacilitate conversations with students as they complete the page of the Bridge Inspection Report related to the size of the crack. While students' data points may be slightly variable, the overall pattern in the data should be similar. If a group gets a size calculation that is significantly larger or smaller than the others, be sure that they are using the correct section of their data.
To help students understand how they are using their data to draw conclusions, ask questions like:
- Can you explain how you used your data to figure out the size of the crack in the bridge?
- What if you found a crack of 36mm – what size category would that fall into? How do you know? What about a crack of 12mm? Or 100mm?
To help students connect the data visualizations in Labs 2 and 3, ask questions like:
- What did you learn from the data on this page that is different than what you learned from the data in Lab 2?
- Why do you think it is important to know about both the location data from the previous Lab and the size data from this Lab?
- Does the colored in section of the bridge surface on this page align with the graph you made in Lab 2? How are they similar? How are they different?
If students complete the page early and are ready for an additional challenge, have them color in the remaining sections of the bridge surface.
- Have students identify the hue values of the remaining sections of the bridge. They can then match those hue value ranges to a color on the hue chart. Students can then color in the rest of the pattern on the bridge based on their data.
- RemindRemind students that they are focusing on only the data points that represent a crack in the bridge. They should not have any data points on this page that have hue values under 200.
- AskAsk students about how they think the data they collected in their role as Bridge Inspectors might be similar or different to how real bridges are inspected around the world. Do they think bridge inspectors might use robotics to help them collect data? Why or why not?
Mid-Play Break & Group Discussion
As soon as every group completed the size and category page of the Bridge Inspection Report, come together for a brief conversation.
We're nearly ready to complete our Bridge Inspection Report. Before we make our official determination of the safety of the bridge, let's first recap what we've learned. Consider the following discussion starters:
- What criteria do we need to know if a bridge is 'Safe', 'At Risk', or 'Dangerous'?
- Is there a crack in our bridge? How do you know?
- Where is the crack located? Is it in the Safe Zones or the At Risk or Dangerous Zone? How do you know?
- Is the crack small, medium, or large? How do you know?
Now that we know all of this information about the bridge, we are ready to complete our official report.
Part 2 - Step by Step
- InstructInstruct students that they are going to complete the Bridge Inspection Summary. They will use everything they have learned about the bridge to determine if it is dangerous and in need of repair.
Example Bridge Inspection Summary - ModelModel for students how to complete the Bridge Inspection Summary.
-
Using the data they have collected and represented in the entire Bridge Inspection Report, students will answer each of the three questions at the top of the Summary.
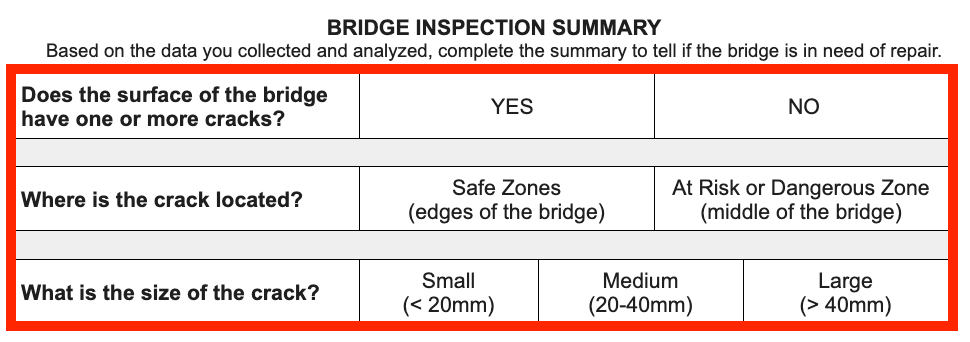
Bridge Inspection Summary Questions - Ask students which part of the Bridge Inspection Report they could use to answer each question.
- The Data Log and graph completed in Lab 2 can be used to answer the first and second questions.
- The third question can be answered with the size and category page they completed in Play Part 1 of this Lab.
- Students can color in the blocks with their answers, or check them off.
- Ask students which part of the Bridge Inspection Report they could use to answer each question.
-
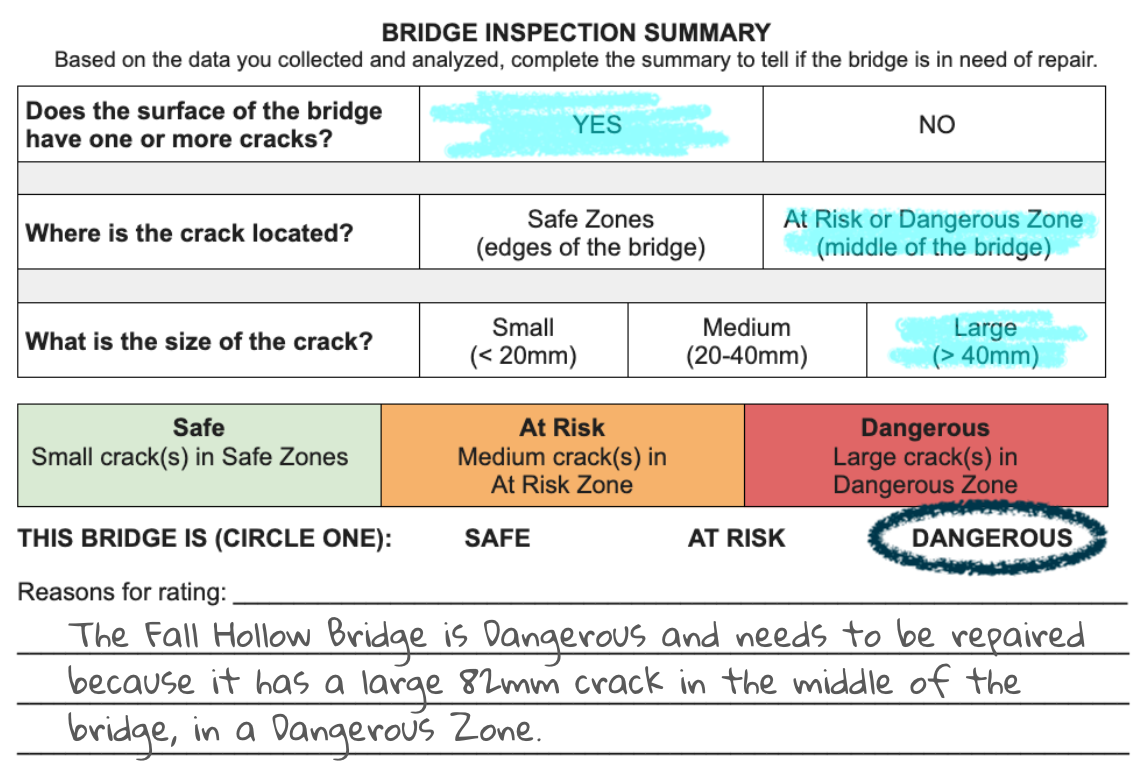
Then, using the safety criteria, students can circle the overall rating of the bridge – 'Safe', 'At Risk', or 'Dangerous'.
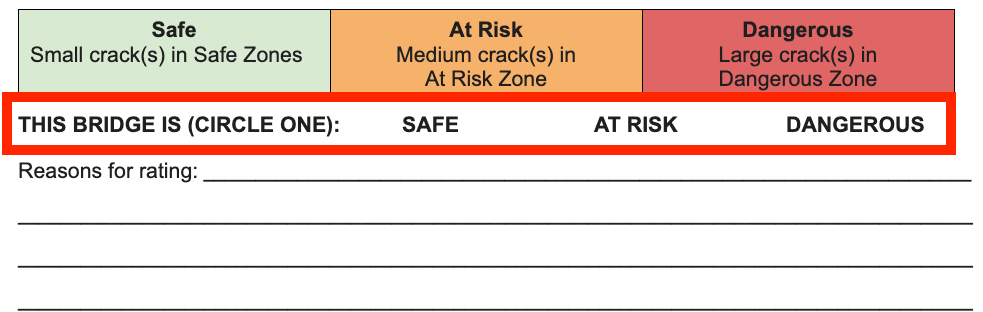
Circle the bridge rating - Be sure that all members of the group agree on the rating.
-
Finally, students should write their reasons for this rating in the space provided. They should represent all of the safety criteria in their reasoning – the presence of a crack, its location, and its size.
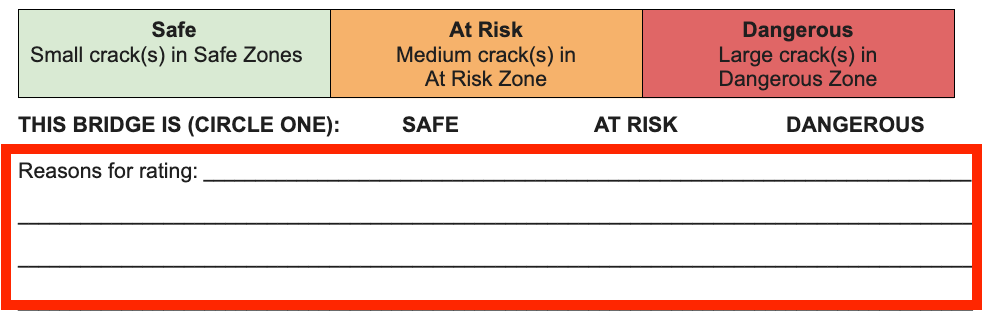
Write the reasons for the rating
-
- FacilitateFacilitate conversations with students as they complete the Bridge Inspection Summary in their groups.
Be sure that students understand how they are using the data they collected in connection with the safety criteria. Ask questions like:
- Which part of your report did you use to answer the question about whether or not the bridge was cracked?
- Which part of your report did you use to answer the question about the location of the crack?
- Which component of the report did you use to answer the question about the size of the crack in the bridge?
- Is anything about your data confusing when you compare it to the criteria? Why or why not?
- Do you have enough information to make an overall rating now? What did you learn in this Lab that you did not know at the end of Lab 2, that helped you make an accurate rating?
Help students structure their written response by using a common template of Claim, Supporting Evidence, Reasoning. Use sentence starters like these to help students get started:
- Claim: "The bridge is classified as ___________ and (needs or does not need) to be repaired."
- Supporting evidence: "The data shows that ____________." or "Based on _____________."
- Reasoning: "Based on the evidence we conclude that ___________." or "All of this proves that __________."
Support students in collaboratively deciding on their Bridge Inspection Summary rating. Ask students about how they are working together to make a decision that the group agrees with, by asking questions like:
- Do you agree on the safety of the bridge? How did you come to that decision together?
- Did anyone think something different about the bridge safety? How did you resolve the issue to come to an agreement?
When students complete their Bridge Inspection Summary, have them check in with you. Each group should have completed the entirety of the Bridge Inspection Report, including the reasoning for their rating.
- Once students complete their report, they can turn their bridge over to see if their data aligns with what they see on the Tile.
- Does the pattern in their data correspond to the pieces on the Tile? How so?
- Is there anything surprising about what they see compared to what their data showed?
- RemindRemind students to complete the Bridge Inspection Summary and to write about their group's reasoning for their rating in sentences. Being able to articulate their data in written form is a helpful way to ensure that students understand what data they collected, and how it can be interpreted in relation to the Bridge Safety Criteria. Be sure that all members of the group agree with what is in the summary, and can explain it to you.
- AskAsk students if they have ever had to use data to answer questions like they did in the Bridge Inspection Summary before. How might practicing this skill be helpful to them in the future? What are some scenarios where they look at data to make a decision about something?
Some examples you can use to help students think about data usage in their own lives include:
- Deciding what size of birthday cake to get based on how many people are coming to the party
- Looking at how much tread is left on car tires to decide if they need to be replaced
- Thinking about how often a toy was used in the last year to help determine if it is ready to be donated
- Keeping track of how many points you need to level up in a video game
- Earning a privilege based on how many chores you do at home