
Play
Part 1 - Step by Step
- InstructInstruct students that they are going to change the driving surface to see how that affects the motion of the Super Car. While they have freedom to create their own roadways for their Super Car to travel on using different materials, they must follow the following steps:
- Design - What is it going to look like?
- Predict - What do you think will happen?
- Build - Create the design with your materials.
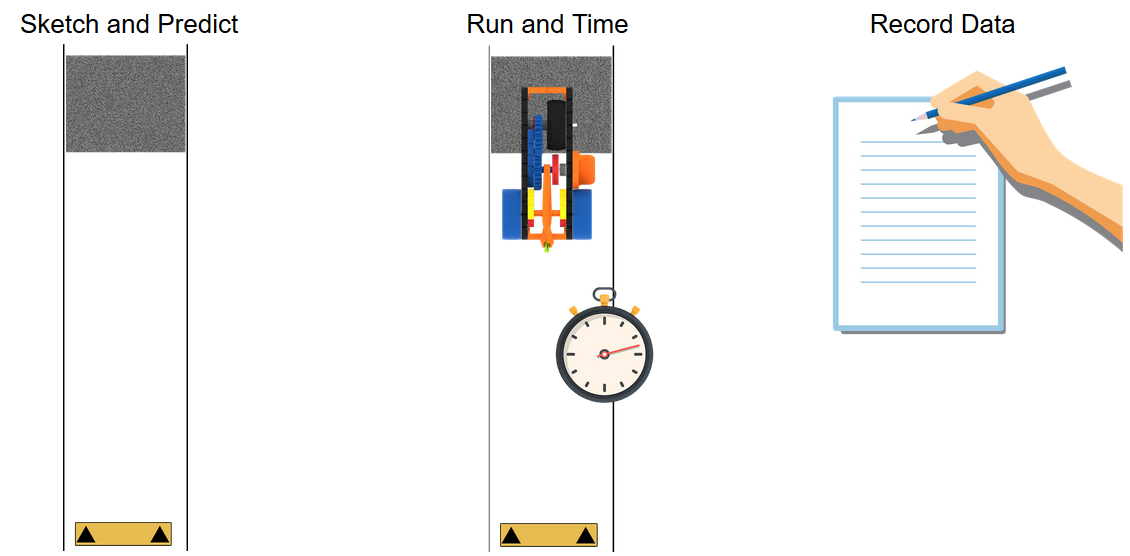
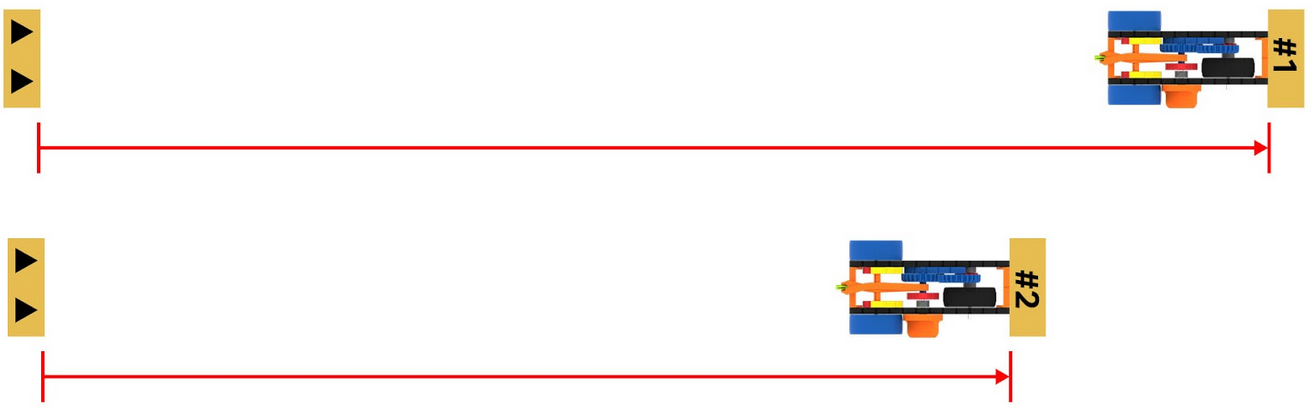
- Run - Send the Super Car on the road for at least 2 successful trials.
- Record - Track the results on the charting sheet.
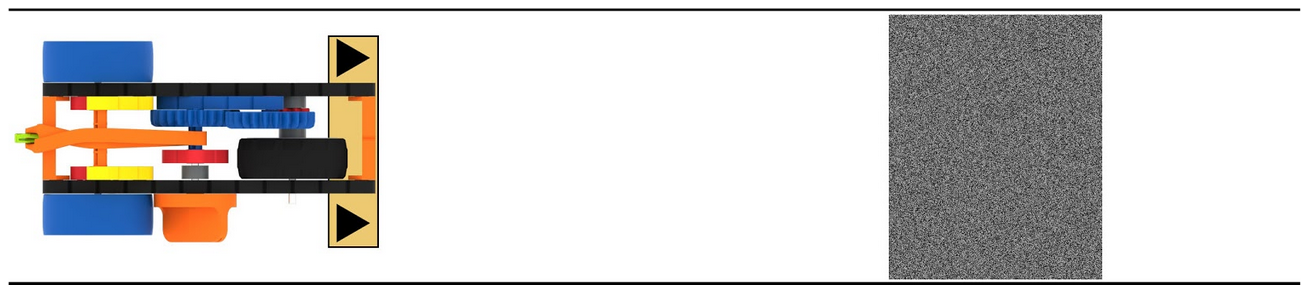
Example Roadway - ModelModel using one team’s set up, how to follow this process. Sketch the design on the board, record the variable changed, offer or ask for a prediction, quickly set up the roadway, run and time the Super Car, then chart the results.
Model Trial - FacilitateFacilitate as students are running their experiments by walking around the room and asking students about their ideas for their design. Some questions to ask could include
- What variable are you changing and why?
- Do you think the car will travel fast or slow?
- Explain how your variable is related to the energy needed to move the Super Car.
- RemindRemind groups to only change one variable at a time, and to use the same number of knob turns for each trial. Also ensure students are recording consistent and accurate measurements.
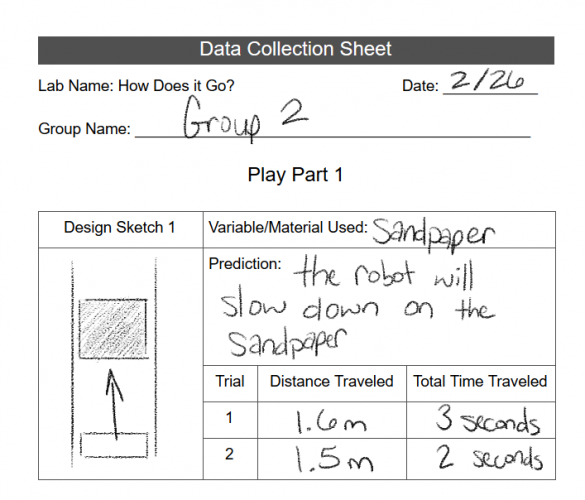
Example Data Collection Sheet - AskAsk if there are any questions about the process before the groups begin, and answer them with the whole group.
Mid-Play Break & Group Discussion
As soon as every group has accomplished 6 total trials with 3 variables, come together for a brief conversation.
- What materials did you use? How did each of the variable changes affect the distance the car traveled?
- Pick one variable to best explain how the variable changed the way the Super Car moved.
- Example: Carpet square.
- Was the Super Car faster or slower while on the carpet square?
- Why do you think that was?
- Did the Super Car have more or less energy while it was traveling across the carpet square?
- You can repeat these step by step questions with all variable changes or have groups pair up to talk through the same discussion.
- What did you notice about the time it took the car to travel? Did you notice any patterns?
- What if we wanted the car to go a shorter distance?
Part 2 - Step by Step
- InstructInstruct the students that now that they will now be challenged to change one more variable to allow the Super Car to travel slower and for a shorter distance. Students will have two trials with this final variable.
Travel Shorter Distances - ModelModel using a group’s setup, how to follow the same process of sketching the roadways for their Super Car to travel on using different materials, making predictions, running and timing the car, and recording the data as in Play Part 1, to make the Super Car travel a shorter distance.
Model Trial - FacilitateFacilitate the experiment walking around the room and asking students about their design process. Some questions to ask could include:
- Why do you think your variable will allow the car to move a shorter distance?
- What do you think makes the car move slower?
- What is the relationship between the energy to move the Super Car and it traveling a shorter distance?
- RemindRemind groups to only change one variable and take consistent and accurate measurements.
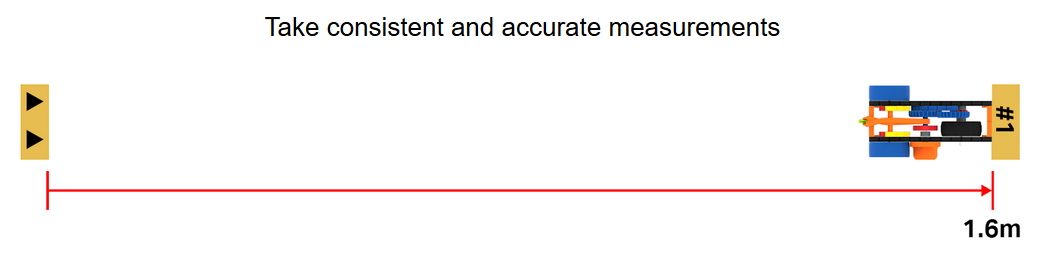
Measurement - AskAsk students “When the car moves slower, do you think it always travels a shorter distance?”
Optional: Groups may deconstruct their Super Car if needed at this point in the experience. They will use the same build in the subsequent labs, so this is a teacher option.