
Play
Part 1 - Step by Step
- InstructInstruct each group to set up a test trial space and their Data Collection Sheet. Watch the animation below to see the Super Car being wound up before being set down to drive and have the distance driven measured.
- Include a starting line, and attach the measuring tape to the table in a straight, flat line for measuring distance.
- The Data Collection Sheet should include: Trial #, Turn #, Distance. See the Lab 1 Data Collection Sheet Example.
- Students should look for patterns in the data that they collect.
Test Trial Set Up - ModelModel a test trial for the class using a group’s setup, and complete a sample chart on the board. Watch the animation below to see the Super Car being wound up before being set down to drive and have the distance driven measured.
- Wind the car up at the starting line, counting each turn of the Orange Knob aloud as you wind it.
- Let it go and mark the distance traveled with a second piece of tape.
- Measure the distance between the two, and write the measurement in the Data Collection Sheet.
Test Trial Set Up - FacilitateFacilitate as each group completes at least 5 trials of the Supercar, with the journalists tracking data on the chart. Students should take turns setting up the car and winding it.
- RemindRemind groups to experiment with the number of turns they use to wind the car, and to use at least 3 different numbers over the course of their trials
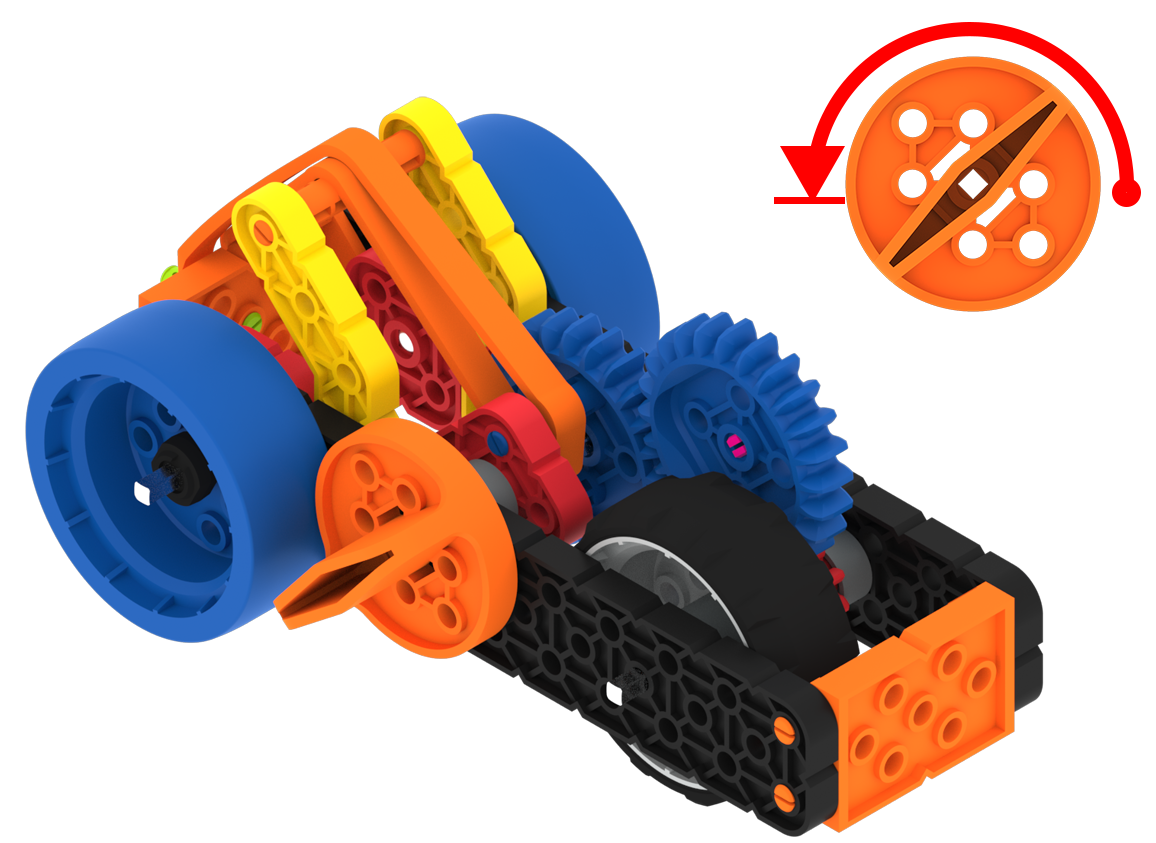
Turning the Orange Knob - AskAsk students to make predictions about how far or fast their car will travel on the next trial you move around the room. Guide students to notice that more turns will cause the Super Car to move faster.
Optional: If any notable observations or theories emerge about patterns of movement or cause and effect, have students note them as well, and tie this into the Share discussion.
Mid-Play Break & Group Discussion
As soon as every group has accomplished 5 trials, come together for a brief conversation.
- Do you notice any patterns in the data collected?
- How fast did your Super Car travel? Was it always the same?
- What do you think makes the Super Car faster? Slower?
- How many times did you turn the knob on the Super Car when it moved the fastest? Was that more times or fewer times than when the Super Car moved the slowest?
Part 2 - Step by Step
- InstructInstruct each group to bring their car to a central race area. Use a team’s trial run area if space allows, or create a central space in the room.
- The goal of the race is to have the car that drives the farthest distance.
- Students will use the data from their trials in Play Part 1 to make predictions and plan for the race.
- They will need to decide how many knob turns to use in order to cause their car to travel the farthest.
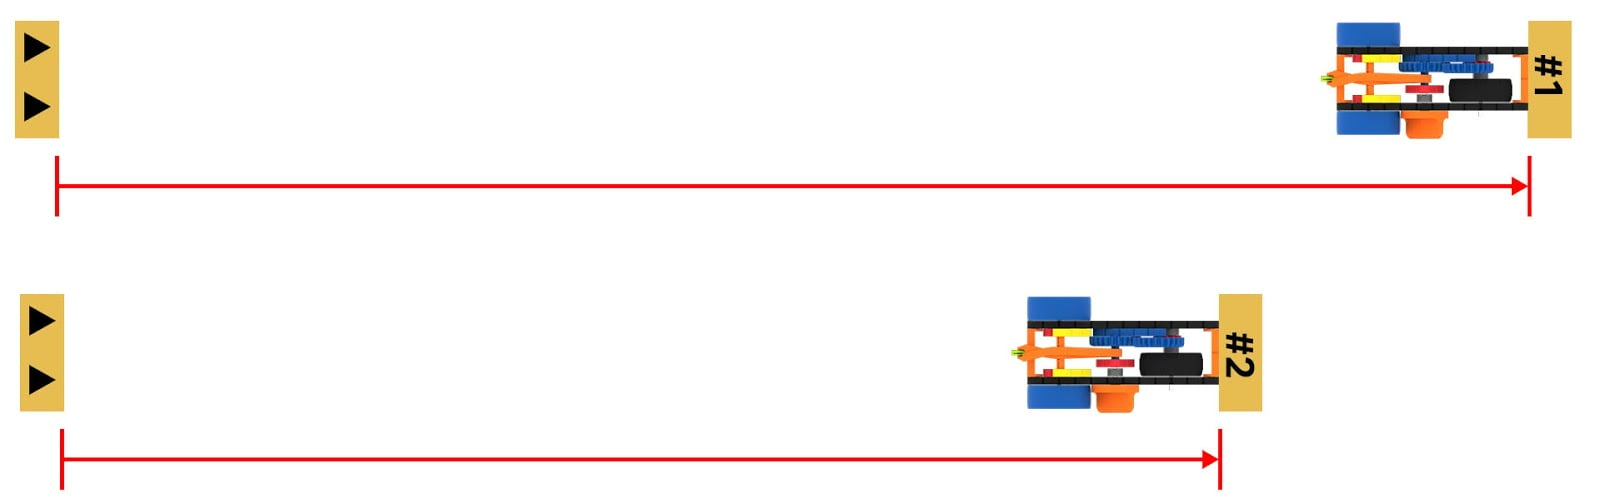
Super Car Distance Race Set Up - ModelModel for students how the Distance Event will work, and how to use a prediction chart for data collection. Watch the animation below to see an example of a Distance Event heat. Two Super Cars are placed at the starting line, and begin to drive at the same time. The winner is the Super Car that travels the furthest.
- Groups will compete in "heats" or rounds. Watch the animation below to see a heat in action featuring two competing Super Cars.
- Anywhere from 2-4 groups can enter their Super Cars in each "heat" (depending on space).
- Mark the starting line with tape. Use a second piece of tape to mark the place where the car stops.
- Measure the distance between the two. Longest distance wins!
- Winners of each heat move to the next round until a final winner is declared.
Video fileCreate a prediction chart on the board. Have each group declare how many turns they will use, and how far they predict the car will go before the group race. An example of a prediction chart could be a table, showing what the student thinks will happen, and what actually happened.
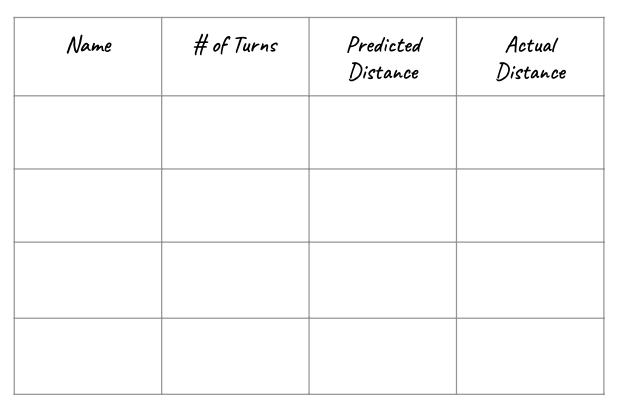
Example of a Prediction Chart Optional: Students can use the Data Collection Sheet to keep their own prediction charts and race results as the Distance Even is going on.
- FacilitateFacilitate the races and data collection.
- Guide students to accurately measure the distance traveled.
- Ask students about the relationship between the team's predictions and the performance of the Super Car in the race. Encourage students to use the data to explain their reasoning.
- Look for opportunities to promote good sportsmanship.
- RemindRemind students that the goal of the race is to have the car that travels the farthest. How can they use the data collected in trial runs and discussion to plan their winning strategy?
- AskAsk teams to identify patterns on the Class Data Chart:
- Do they see a relationship between the number of knob turns and the distance traveled?
- What were the longest and shortest runs? What do they think caused these results?
- What do they notice about the speed of the Super Car in the race? What do they think causes the Super Car to move faster or slower?
Optional: Teams may deconstruct their Super Car if needed at this point in the experience. They will use the same build in the subsequent labs, so this is a teacher option.