
Play
Part 1 - Step by Step
- InstructInstruct each group to set their Super Car at the start of the tape line. The goal is to use the stopwatch to time how long it takes the car to travel 40cm (~16 in).
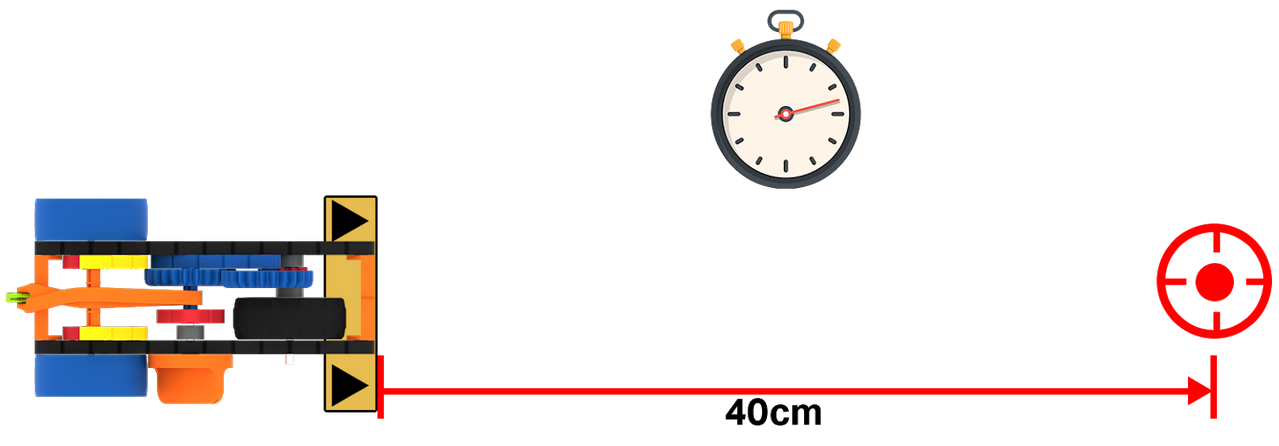
Record Distance and Time - ModelModel how the trial should work using a group’s setup. Show how to start and stop the stopwatch, and record the time on the Data Collection Sheet.
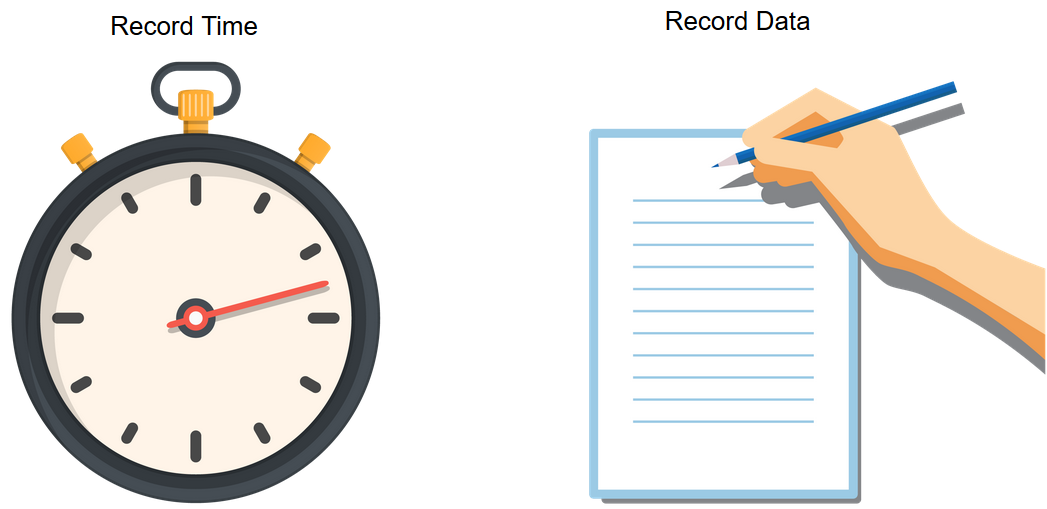
Record Time and Data - FacilitateFacilitate as groups begin to run their trial, make sure that timers are paying close attention to get accurate times.
Record Accurate Times - RemindRemind groups to round their times to the nearest full second on their charts. Put rounding reminders on the board to prevent confusion.
- AskAsk students to write down the data right away on their Data Collection sheet when they finish the trial.

Example Data Collection Sheet
Mid-Play Break & Group Discussion
As soon as every group has accomplished running the trial, come together for a brief conversation.
- Have teams write their times on the board. What do you notice about these times? Are they similar/different? Why might that be?
- Speed measures not just time, but also distance. If we wanted to figure out the average speed of the car, how would we do that?
- Let’s calculate the average speed of the Super Car by dividing the total distance traveled by the total time. How do we feel about calculating speed?
-
Example: If the Super Car traveled 30cm (~12in) in 5 seconds, the equation would look like this:
Average Speed = Total Distance ÷ Elapsed Time
6 cm/s = 30cm ÷ 5s
- Use numbers provided by your students for this example calculation. Round to the nearest full number for your average speed calculation.
-
Part 2 - Step by Step
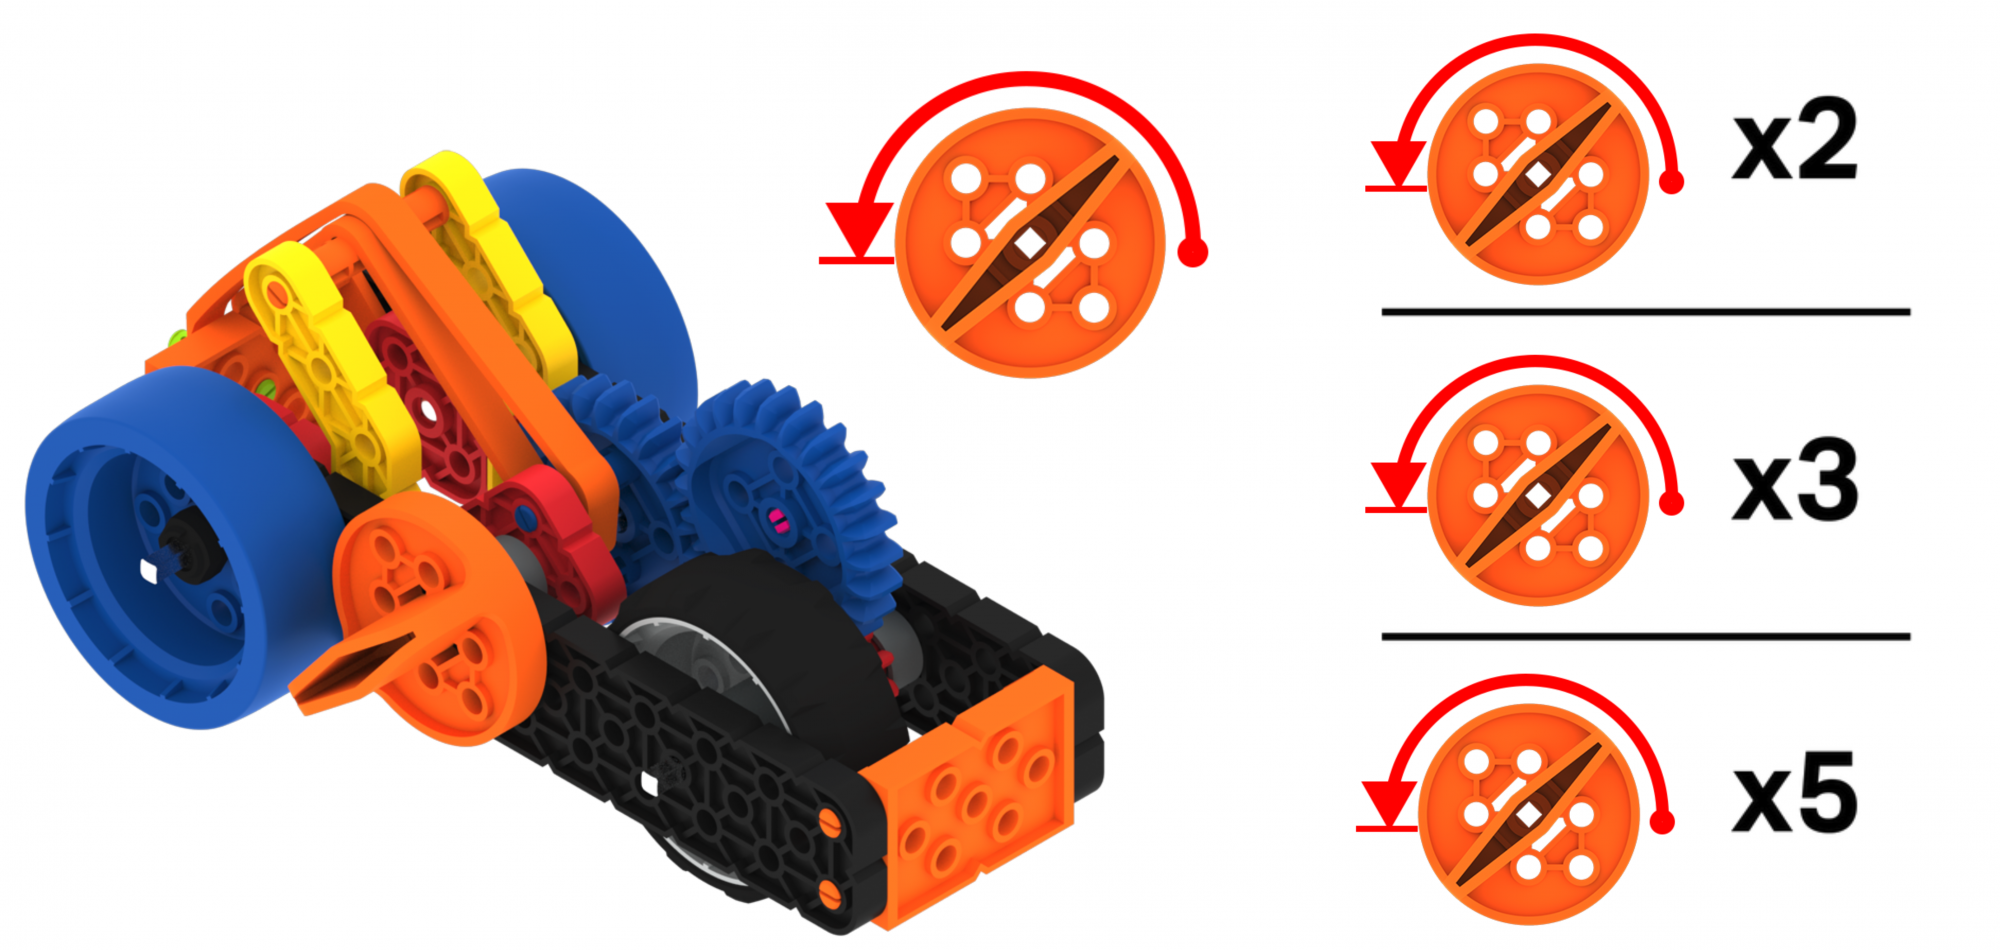
- InstructInstruct each group to write their estimations on the Data Collection Sheet before calculating the average speed of the Super Car with three different variables. Students will turn the Orange Knob 2 times, 3 times, and 5 times, and calculate the average speed on their Data Collection Sheet.
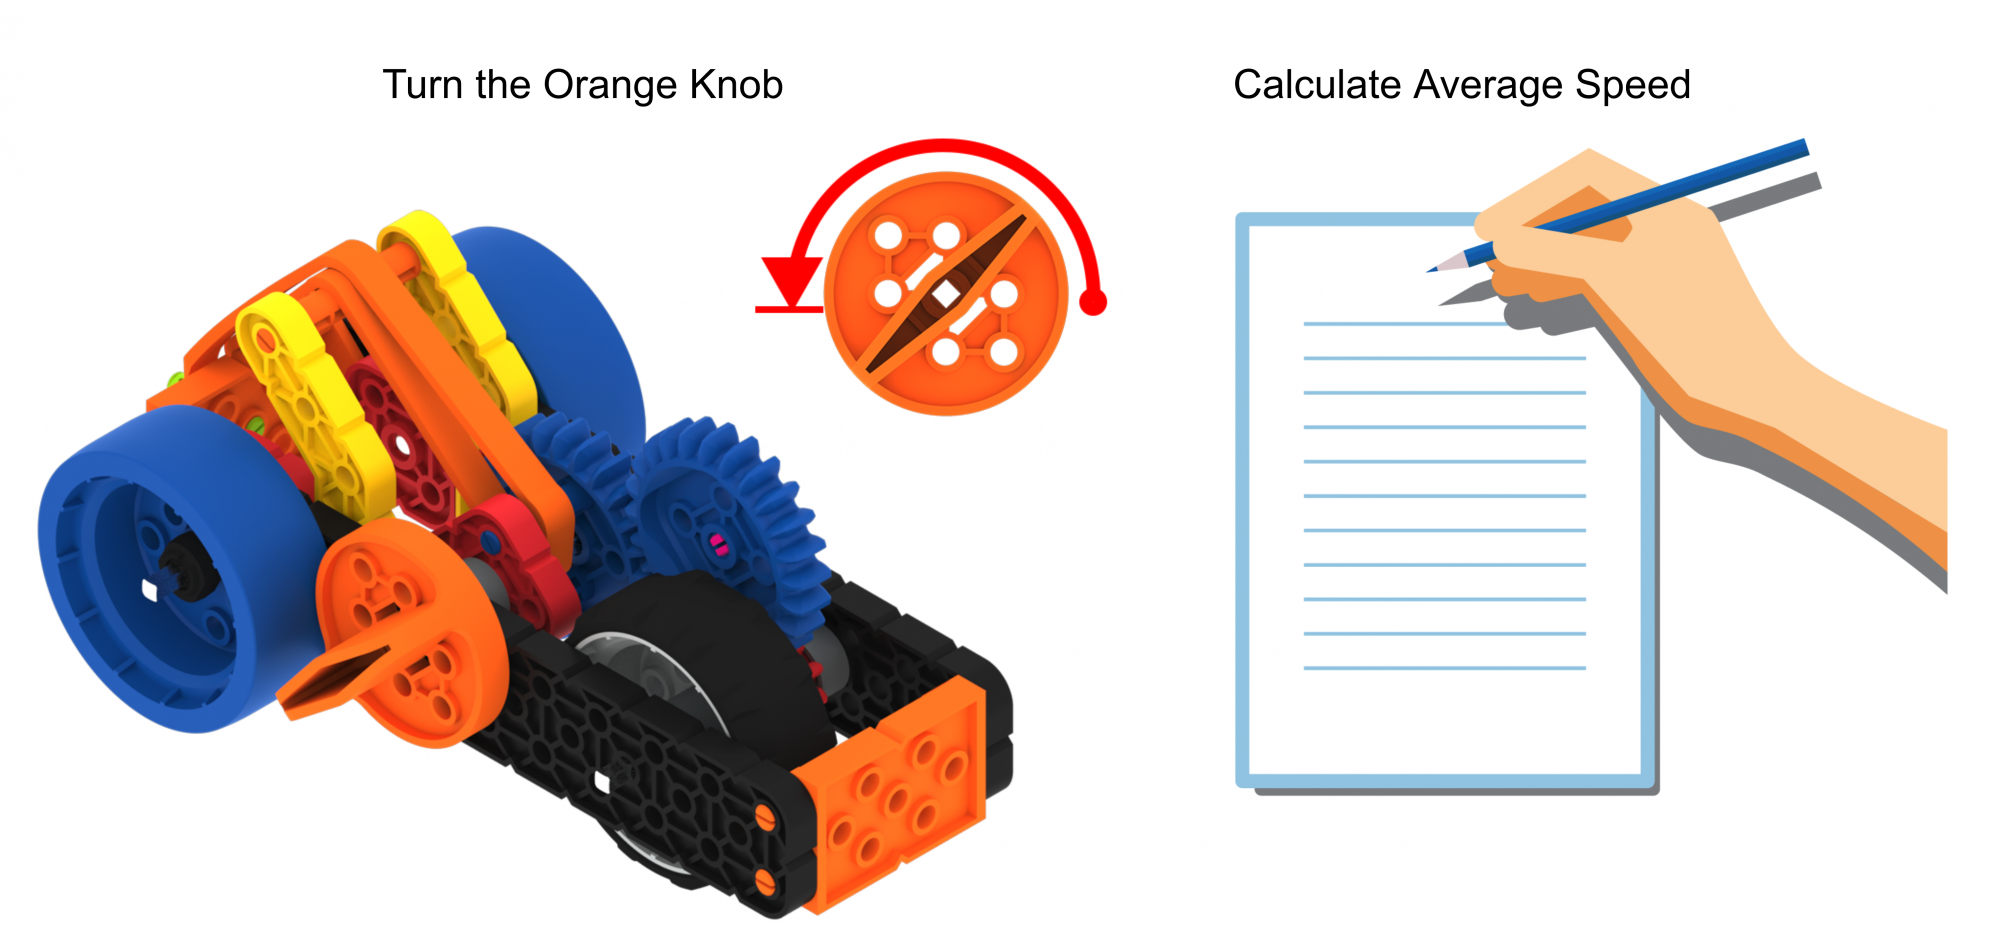
Turn the Orange Knob and Calculate Average Speed - ModelModel using a group’s setup, how you will turn the Orange Knob on the Super Car.
Turn the Orange Knob Multiple Times - FacilitateFacilitate while groups conduct trials and help with measuring from the start to stop point of the distance the Super Car traveled when needed.

Facilitate Group Work - RemindRemind groups to predict the average speed of the Super Car before starting trials. Also remind them to use a ruler or measuring tape to get accurate distance measurements.
- AskAsk students to explain how the number of turns on the Orange Knob affect the way the Super Car travels.
Optional: Groups may deconstruct their Super Car if needed at this point in the experience.