
Previously, you used time-based movements to move a Disk from the Entry Conveyor to the Exit Conveyor. As you were doing this, there was a chance that the Disk would fall off the end of the Exit Conveyor.
In this Lesson, you will learn about:
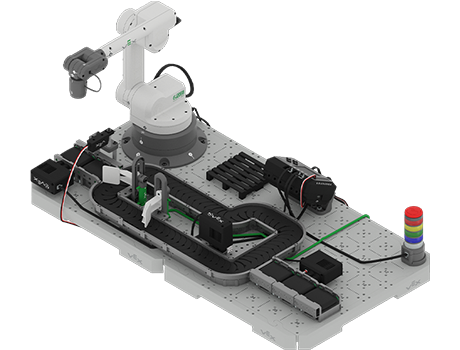
- The Object Sensor in the CTE Workcell Kit
- What values are reported by the Object Sensor
- Collecting reflectivity data using a VEXcode project
At the end of this Lesson, you will collect data from the Object Sensor in your engineering notebook and answer questions.
Object Sensor
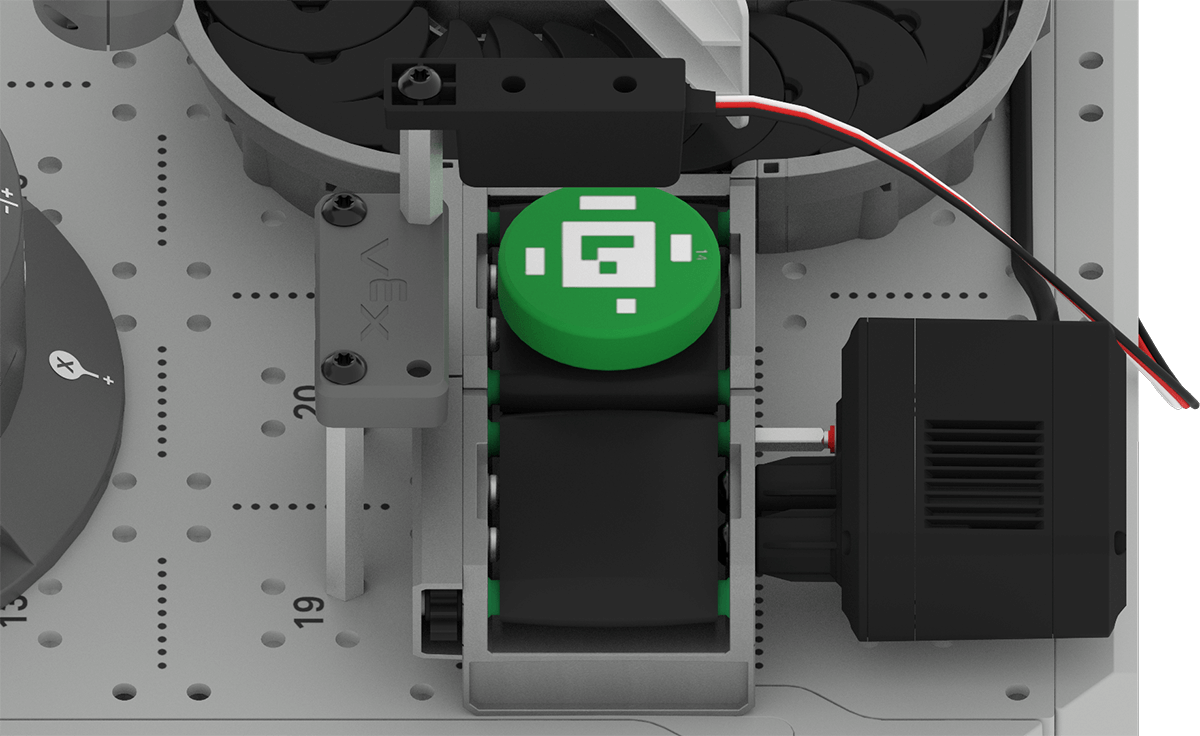
The Object Sensor in the CTE Workcell Kit works by illuminating a surface with its infrared LED and then measuring the reflected infrared radiation with its infrared light sensor. Based on the intensity of the reflected radiation, the Object Sensor can determine if an object is below the sensor.
The Object Sensor is an analog sensor that will return a value between 0% and 100% light reflectivity. If the reflectivity percentage is high, that means there is an object present reflecting the infrared. If the reflectivity percentage is low, that means there is no object there reflecting the infrared.
Analog versus Digital Sensors
Because the Object Sensor is an analog sensor, the values returned on the Devices Screen will not appear as 0-100% reflectivity. Instead, the values will appear as numeric data up to four digits long. Analog sensors continuously report values within a given range without any digital conversions. In contrast, digital sensors take readings, then convert those into specific numerical values. The Optical Sensor used in a previous Unit is an example of a digital sensor. The sensor took a reading, then converted that data into the numeric hue value of the object. This meant that only the converted data from the Optical Sensor appears on the Devices Screen.
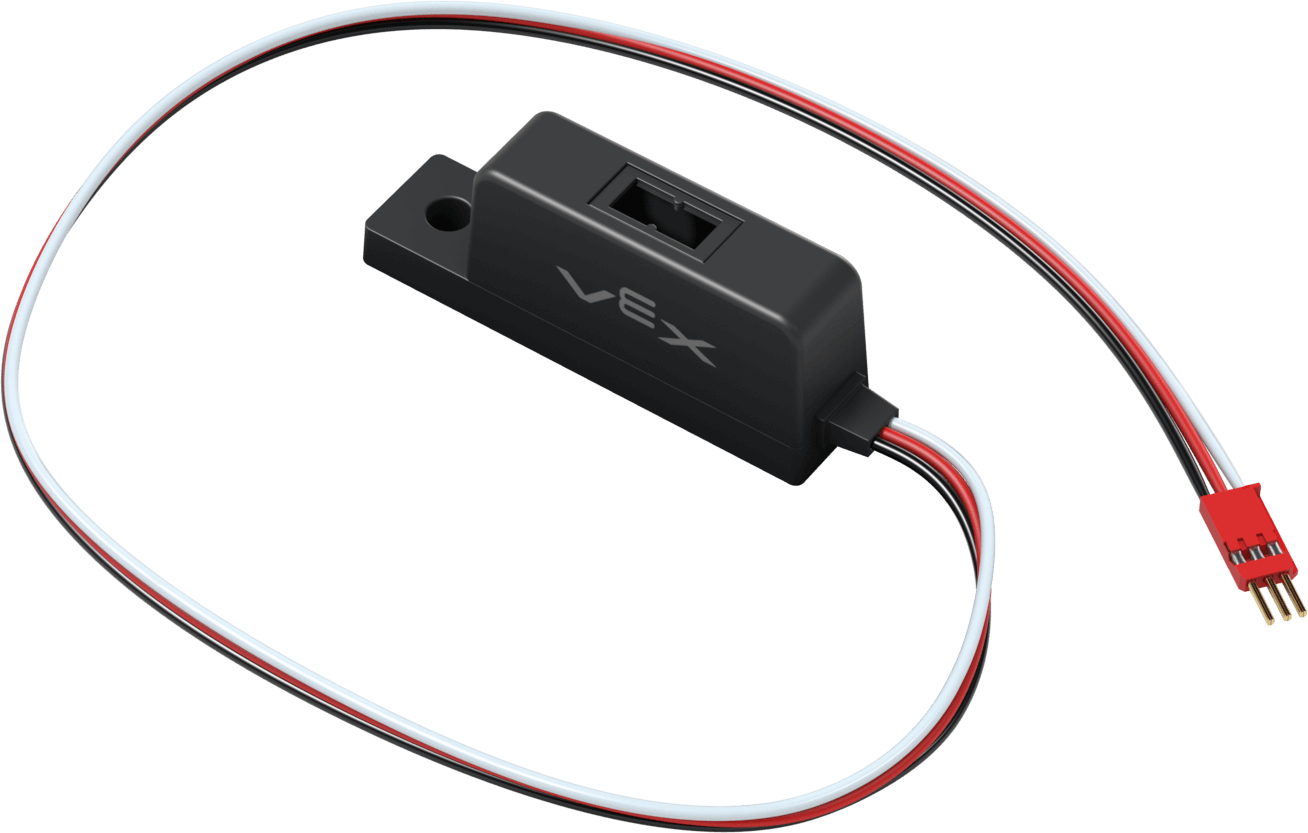
You can tell the difference between analog and digital sensors in the CTE Workcell Kit by looking at how the sensor is connected to the EXP Brain. Sensors connected with a 3-wire cable are analog, and sensors connected with a Smart Cable are digital.
Viewing Object Sensor Data
The Brain reports the values exactly as given from the sensor. Because of this, a VEXcode project is needed to determine the reflectivity percentage. Follow along to download a project to view device information from the Object Sensor.
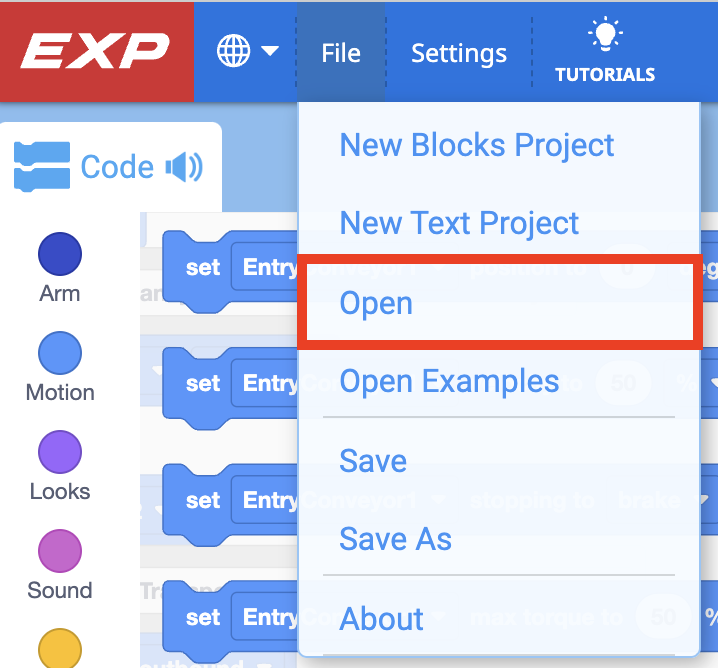
Download this project to your device and open it in VEXcode EXP.
When the link is selected, the project will automatically download to your device.
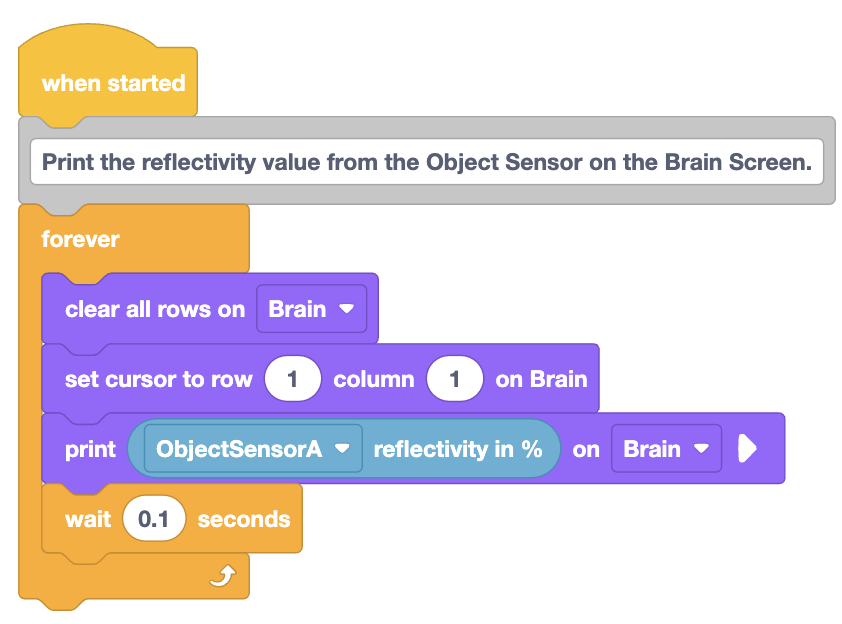
Observe this stack of blocks. What do you think will happen when the project is run?
Record your predictions in your engineering notebook.
Be sure the Brain is connected to VEXcode, and download the project to the Brain.

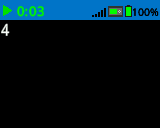
Run the project to test it. Record the value on your Brain Screen in your engineering notebook.
The number you see on the Brain Screen is the reflectivity value when no object is present on the Exit Conveyor.
Note: Your value may differ than the one shown here. Be sure to record the values on your Brain Screen during this testing.
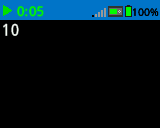
Now place a green Disk on the Exit Conveyor underneath the Object Sensor. How does the reflectivity data change when the green Disk is present?
Record the reflectivity percentage of the green Disk in your engineering notebook.
Activity
Now that you have printed Object Sensor data to the Brain Screen, you are going to explore this data further. In this Activity, you will use the same downloaded VEXcode project to test the reflectivity of additional objects. You will record and compare the reported sensor data as you go.
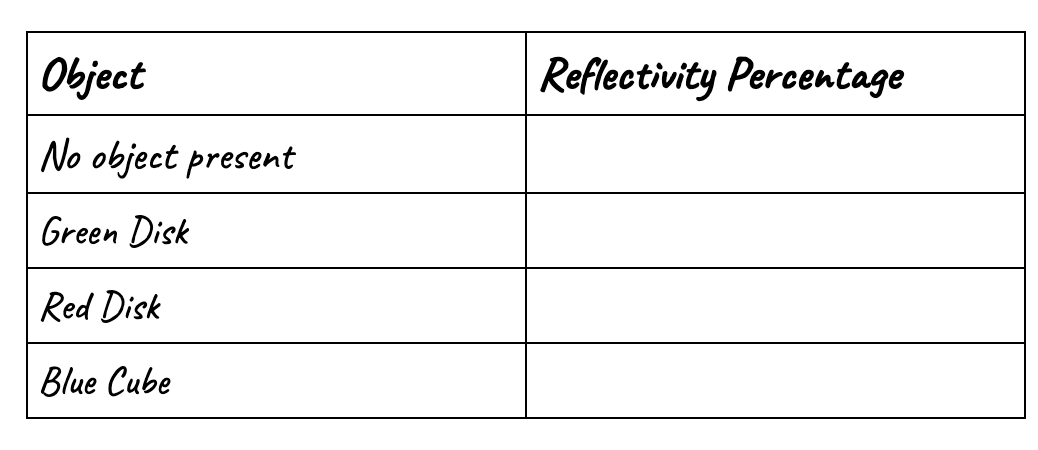
Activity: Explore the reflectivity data reported by the Object Sensor.
- Create a table such as the one above in your engineering notebook.
- Transfer the reflectivity data the you recorded earlier (for no object and the green Disk) to the table.
- Test the red Disk by placing it under the Object Sensor.
- Record the reflectivity data for the red Disk on the table in your engineering notebook.
- Place a blue Cube under the Object Sensor. Record the data reported in the same way that you did for the red Disk.
- Observe the data recorded on the table and answer the following questions in your engineering notebook:
- Which object had the highest reflectivity percentage?
- Which object had the lowest reflectivity percentage?
- Why do you think the reflectivity percentages differ between objects?
- How do you think the reflectivity percentage could be used in a VEXcode project?
Check Your Understanding
Before moving on to the next Lesson, ensure that you understand the concepts in this Lesson by answering the following questions in your engineering notebook.
Check Your Understanding questions > ( Google Doc / .docx / .pdf )
Select Next > to move on to the next Lesson.